Boomer Boom Bang-a-Bang

London’s population reached a historic high of 8,945,300 in the middle of last year, according to new estimates released by the Office for National Statistics. After slower growth at the end of the 2010s and a slight decline between 2019 and 2021, the number of people living in the city rose by 0.9 per cent – around 75,000 – between 2022 and 2023, the fastest growth rate since 2015-16.

Does this suggest that London has escaped the twin shadows of the Covid-19 pandemic and Brexit and is returning to its turbo-charged growth of the late 2000s and early 2010s? Well, maybe and up to a point.

Certainly, the capital has defied some of the more apocalyptic predictions that emerged during lockdown – of the age of cities stuttering out in an “urban doom loop”. But it is still growing more slowly than other UK regions and metropolitan areas, most of which grew by one per cent or more in 2022-23. London’s growth rate is in fact more like what other regions were experiencing ten years ago, when the capital’s population was surging by 100,000 or more every year – a growth rate of up to 1.4 per cent.

London is also growing a bit more slowly than experts forecast. The mid-2023 estimate is very slightly lower than that of the most cautious Greater London Authority (GLA) population projection, which was based on the 2021 Census and projecting forward the slower growth trends from 2017-21.

Borough patterns suggest a mixture of recovery and longer-term trends. In some places, the return to growth looks like a post-pandemic rebound. This is most notable in Camden, which saw one of the steepest declines in population at the beginning of the pandemic but has now more than recovered, with 2.9 per cent population growth between 2020 and 2023.

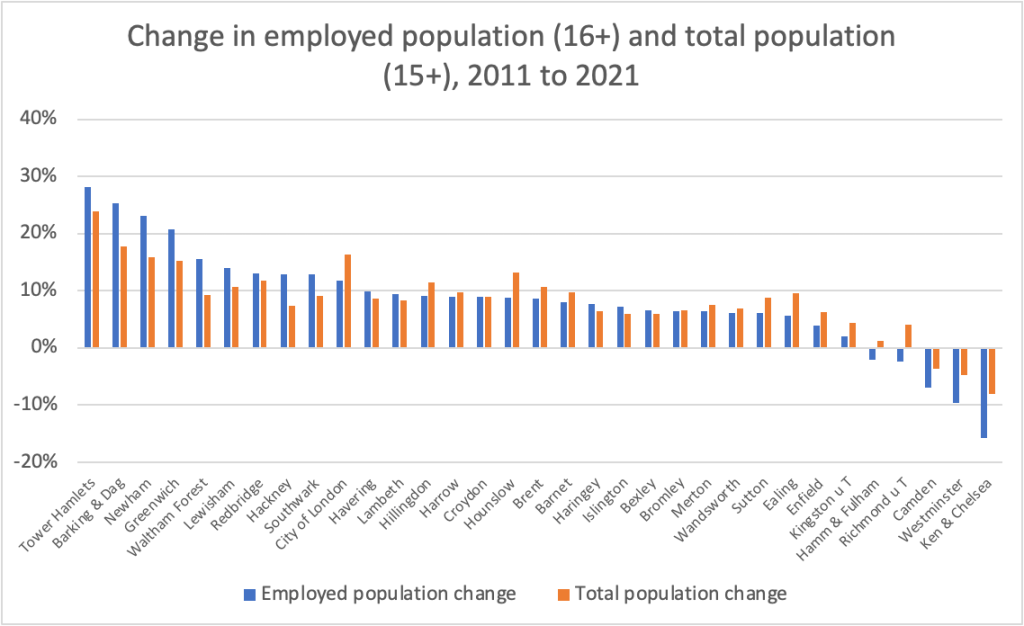
But there appear to be broader trends operating too. Hillingdon, Tower Hamlets and Newham have each shown persistent growth, adding at least four per cent to their populations between 2020 and 2023. On the other side of the equation, Lambeth, Lewisham, Haringey and Waltham Forest all have populations that remain two to three per cent below their pre-pandemic levels.

Even if London’s growth has slowed, its population dynamics remain distinct from those of other parts of England and Wales. The capital continues to see much higher international inward migration (around 154,000 in the year to mid-2023) and domestic outward migration (130,000 in the same year) than other regions.

The capital’s population is also buoyed by natural change – the surplus of births over deaths – which accounts for growth of 50,000 in the year to mid-2023. Meanwhile, across England and Wales this has dwindled to nothing or gone into reverse, with as many people dying as being born for the first time in 42 years.

London is still younger than average (both a factor in and a result of its natural growth rate): its median age is 35.9, compared to 40 or older in every other region in England and Wales. The age groups that have seen the fastest growth since the pandemic abated (2021) are people in their twenties and in their sixties. However, longer-term (since 2011) the twenty-something population has declined, and the fastest growth has been among Londoners in their fifties and sixties – maybe those who lucked out by buying property in the 1980s and 1990s.

International comparisons suggest that London is not alone in its population growth patterns. Slow recovery is the norm following Covid, and other large northern hemisphere cities were already seeing a slowdown before 2020. US Census Bureau estimates suggest that in 2023 New York City’s population was still six per cent below its April 2020 total, though population loss is slowing. Paris has also seen a long-term decline, largely as a result of falling birth rates, which accelerated during the pandemic.

Cities have not gone away, but their slow recovery perhaps reflects the unexpected “stickiness” of changes in working habits and a sedate return to international migration patterns. If that is so, London’s slow growth may just be a delayed bounce-back. Comparisons with the GLA projections suggest this might be the case: those projections modelled growth slowing in 2022-23, whereas in fact it speeded up.

It may also be that growth is constrained as the cost of living in the capital remains sky-high and London struggles to meet the London Plan’s housebuilding targets, let alone the more ambitious goals suggested by the last government and think tanks such as Centre for London.

This should be a cause for guarded optimism. If policy and delivery are constraining growth we can turn that round, adopting the “Get Britain Building” mantra of the new government. London can build its way back to sustainable growth as a liveable and exciting destination for UK citizens and international visitors – provided of course that other measures, such as arbitrary immigration restrictions, do not stifle the UK’s world city.

First published by @OnLondon.

Working it out

Local and regional employment statistics from the 2021 Census were released this week, giving a snapshot of who is working in London and how this compares with the rest of the country. There are caveats, given that the Census was undertaken in March 2021 at the end of the last Covid 19 lockdown when some Londoners had moved out of the city. Also, these figures are about residents’ economic activity as distinct from the jobs in London’s workplaces. Nevertheless, here are four observations about how Londoners are working, from a brief review of the data.

Employment rates are high in London, but partly for demographic reasons

At first glance, London boroughs are hives of economic activity. There are 331 English and Welsh local authority districts and five of the ten with the highest employment rates were in London. Wandsworth, Lambeth and the City of London took the top three slots, with Southwark and Merton not far behind. All had 65 per cent employment rates or higher.

But these numbers are skewed. Firstly, the headline Census figures look at the entire population over 16 years old, including those above retirement age. London has a younger population than the England and Wales average, and young people tend to work more than older people.

By this measure, therefore, you would expect to find higher employment rates in London. But if you look at employment rates only for those aged 16-64, London boroughs are towards the middle or bottom of the table.

The second factor that seems to have affected London’s figures surprised me. In addition to the effect of having a younger population, older Londoners are much more likely to be working than counterparts elsewhere.

Overall, 14 per cent of people in the capital aged 65 and over are still working, and London boroughs account for eight of the ten districts with the highest employment levels nationally.

The City of London, Kensington & Chelsea, Camden and Westminster all have more than 20 per cent of their older residents in work. London is not so much the city that never sleeps as the city that never retires.

There’s a big employment gap for disabled Londoners, but fewer are economically inactive than in other regions

The employment rate for disabled people over 16 living in London is just under 30 per cent. This is higher than in other regions, though there is a stark gap between employment for disabled and non-disabled people: the employment rate for the former group is 38 per cent lower than for the latter.

There is also a relatively high proportion of disabled Londoners who do not have a job but are looking for one. However, fewer disabled Londoners are economically inactive (ie, not in work, but not seeking work either) than in other regions.

Whether this pattern is because London’s labour market can work well for disabled people, or because economic circumstances and sanctions force more of them to keep looking for work in the capital, is not clear from these figures. Trust for London and other organisations have done extensive work on the subject.

Women’s employment rates are relatively high, but the gender employment gap varies markedly across the city

The employment rate for women in London aged 16 and over was around 57 per cent. That’s higher than in any other English region. Eight inner London boroughs had rates of above 60 per cent.

At the same time, and in common with every other English and Welsh local authority district, employment rates in London boroughs were higher for men than for women. However, there is a very mixed picture across the city.

Newham, Redbridge, Tower Hamlets, Harrow and Barking & Dagenham are five of the eight English and Welsh districts with employment gender gaps of more than 12 per cent, while Hackney, Lambeth and Lewisham have gaps of five per cent or less, which are some of the lowest.

This may partly result from demographics: the boroughs with low employment gaps have many young, single (or newly-coupled) professional people, while the boroughs with wider gender gaps have some of the highest birthrates in London and include communities in which, for cultural reasons, women may be less likely to work.

Worker growth is outstripping general population growth in East London

Between 2011 and 2021 London’s working adult population aged 16 and over and its total population aged 15 and over both rose by around 8.5 per cent. But growth was very unevenly distributed (see chart below).

The east London boroughs have seen rapid increases and in most cases their working population growth has outstripped their general population growth. Other boroughs, particularly in other parts of north and west outer London, have seen their working population grow more slowly than their overall population, and a handful of west-central boroughs have seen a decline in both groups.

Taken together, these figures suggest that London continues to contain extremes of employment and worklessness. Zooming into the ONS’s detailed map, you can find blocks where 15 per cent or more of people aged over 16 are unemployed and looking for work within boroughs that have grown their workforce by 25 per cent over the past ten years.

Londoners are unquestionably working hard. More women, more older people and more disabled people are in the workforce. To what extent this is a result of making positive choices and the general industriousness of urban life, and how far it is driven by the exorbitant costs of living in the capital is another question.

Originally published by OnLondon.