AI: reshaping the knowledge economy

Since their earliest days technology has shaped cities. The industrial revolution founded the great manufacturing centres of the 19th Century; trains fuelled London’s growth, replacing market gardens with metro-land; and global information and communication technology networks founded a network of global cities in the late 20th Century.

Right now, social media are clamorous with hype about artificial intelligence (AI), and the pace of change seems dizzying. Anyone who has played with “generative” AI tools such as OpenAI’s ChatGPT, Google’s Bard, or Midjourney’s image generators will have experienced the uneasy feeling that they are dealing with something sentient, however much they know that these systems merely aggregate and recombine information.

Prompt engineering is not straightforward, as this Midjourney representation of ‘futuristic London’ illustrates.

What impact is this wave of innovation likely to have in London, and on London’s economy in particular? In recent weeks, a few academic and commercial studies considering the labour market impact of generative AI have been published. This article tries to weave together some of their threads.

One piece of positive news is that London is the leading European city for AI. A 2021 survey by the government’s Digital Catapult identified the UK as the third most important centre for it after the USA and China, with more than 70 per cent of UK AI firms and – judging by 2020 job postings – around a third of all new advertised AI jobs based in London.

London’s tech sector has grown fast and is estimated to employ around 900,000 people. But the impact of generative AI is likely to extend beyond the capital’s silicon centres and suburbs. One team of researchers, Tyna Eloundou and colleagues, have looked at detailed task descriptions for US occupations to estimate the impact that generative AI technologies could have. Overall, they estimate that 80 per cent of the USA workforce could be affected by them, with around 20 per cent being heavily affected. The impact would be greatest for higher paid jobs and those held by graduates.

The research team has not published details of its analysis, but does summarise the impact on different industries. At the top of the list, with more than 40 per cent of tasks affected, are various financial services and IT subsectors, as well as a publishing and broadcasting (non-internet), and professional, technical and scientific services.

A Goldman Sachs report reaches similar conclusions. It argues that the impact of generative AI will be greatest in advanced western and far eastern economies. In Europe, it suggests the greatest impact will be on professionals, associate professionals, clerical support workers and managers, with legal service and office administration likely to be affected most heavily.

These findings map pretty squarely onto the three categories of professional services which dominate the London economy: information and communications; finance and insurance; and professional, scientific and technical services. These sectors have grown in importance in the capital. They made up 31 per cent of jobs in London in 2022 compared to 27 per cent in 2012. They are also concentrated in the capital, accounting for almost twice the proportion of jobs as across the UK as a whole.

Saying that these “knowledge economy” sectors are those most exposed to the impact of generative AI is more or less the precise opposite to what Centre for London colleagues and I found five years ago in our report on disruption to the capital’s labour market. Based on an analysis of how “automatable” different occupations were, we argued that London’s information and communications and its professional, scientific and technical services had the lowest automation potential (finance and insurance was slightly higher).

Why the difference? Were we wrong? Are these new analyses wrong? What has changed? Without re-running our analysis, I suspect part of the difference lies in occupational mix. Many London workers undertake more specialised and knowledge intensive tasks within particular industries. Underwriting risk at Lloyds of London is very different from working in a claims call centre.

But I think our expectations have shifted too. Generative AI is a qualitative change. When we wrote the Centre for London report, we were generally talking about the scope for specialised algorithms to automate specific routine tasks. These new technologies go further: they can draw on huge databases to generate new content. They can respond to simple user requests, writing and refining algorithms on demand. They can draft summaries, presentations, poems and speeches. They are creating visualisations. They are even being deployed in therapy. This is extending their reach much further into professional services than we envisaged.

Will this change destroy jobs? The traditional response is to say, “No! Every other technology has created jobs. This will too.” I think that is certainly right in the short term. The measure of impact used by the Eloundou study is whether generative AI could theoretically speed up tasks by more than half. A recent empirical study found that AI-enabled workers took an average of a third less time to complete certain standardised tasks and produced a better graded submission at the end. Workers also expressed more job satisfaction, spending more time coming up with ideas and editing, and less time drafting.

This sounds like a potential boost to productivity for London’s service sectors – one the capital and country urgently need. Productivity gains can, of course, be realised by cuts in wage bills, but that is only part of the story. AI may also unleash supply of and demand for new products and services. Economics blogger Noah Smith has compared its impact to that of machine tools, which displaced craft manufacture but led to ever increasing demand for goods and employment in manufacturing – at least for a century or so.

London is perfectly positioned to catch this wave of opportunity, creating new software to meet new demands and launching a new wave of hybrid services, following in the path of fintech and medtech. But the impact may go deeper still. Eloundou and colleagues argue that generative AI is already showing signs of being a “general purpose technology” like printing or steam engines, characterised by “widespread proliferation, continuous improvement, and the generation of complementary innovations”. If that is the case, AI will change our world in ways that we cannot yet comprehend.

All this is wildly speculative. At the extremes, London could be left unaffected by AI, though I fear that would be the stagnation option. Or AI may destroy humanity, making predictions moot. Between these poles, job destruction is by no means certain and if AI allows more leisure time alongside more equitably shared prosperity, that might not be a bad thing. But disruption probably is. London could be in for an exciting but choppy few years.
First published by OnLondon

Working it out

Local and regional employment statistics from the 2021 Census were released this week, giving a snapshot of who is working in London and how this compares with the rest of the country. There are caveats, given that the Census was undertaken in March 2021 at the end of the last Covid 19 lockdown when some Londoners had moved out of the city. Also, these figures are about residents’ economic activity as distinct from the jobs in London’s workplaces. Nevertheless, here are four observations about how Londoners are working, from a brief review of the data.

Employment rates are high in London, but partly for demographic reasons

At first glance, London boroughs are hives of economic activity. There are 331 English and Welsh local authority districts and five of the ten with the highest employment rates were in London. Wandsworth, Lambeth and the City of London took the top three slots, with Southwark and Merton not far behind. All had 65 per cent employment rates or higher.

But these numbers are skewed. Firstly, the headline Census figures look at the entire population over 16 years old, including those above retirement age. London has a younger population than the England and Wales average, and young people tend to work more than older people.

By this measure, therefore, you would expect to find higher employment rates in London. But if you look at employment rates only for those aged 16-64, London boroughs are towards the middle or bottom of the table.

The second factor that seems to have affected London’s figures surprised me. In addition to the effect of having a younger population, older Londoners are much more likely to be working than counterparts elsewhere.

Overall, 14 per cent of people in the capital aged 65 and over are still working, and London boroughs account for eight of the ten districts with the highest employment levels nationally.

The City of London, Kensington & Chelsea, Camden and Westminster all have more than 20 per cent of their older residents in work. London is not so much the city that never sleeps as the city that never retires.

There’s a big employment gap for disabled Londoners, but fewer are economically inactive than in other regions

The employment rate for disabled people over 16 living in London is just under 30 per cent. This is higher than in other regions, though there is a stark gap between employment for disabled and non-disabled people: the employment rate for the former group is 38 per cent lower than for the latter.

There is also a relatively high proportion of disabled Londoners who do not have a job but are looking for one. However, fewer disabled Londoners are economically inactive (ie, not in work, but not seeking work either) than in other regions.

Whether this pattern is because London’s labour market can work well for disabled people, or because economic circumstances and sanctions force more of them to keep looking for work in the capital, is not clear from these figures. Trust for London and other organisations have done extensive work on the subject.

Women’s employment rates are relatively high, but the gender employment gap varies markedly across the city

The employment rate for women in London aged 16 and over was around 57 per cent. That’s higher than in any other English region. Eight inner London boroughs had rates of above 60 per cent.

At the same time, and in common with every other English and Welsh local authority district, employment rates in London boroughs were higher for men than for women. However, there is a very mixed picture across the city.

Newham, Redbridge, Tower Hamlets, Harrow and Barking & Dagenham are five of the eight English and Welsh districts with employment gender gaps of more than 12 per cent, while Hackney, Lambeth and Lewisham have gaps of five per cent or less, which are some of the lowest.

This may partly result from demographics: the boroughs with low employment gaps have many young, single (or newly-coupled) professional people, while the boroughs with wider gender gaps have some of the highest birthrates in London and include communities in which, for cultural reasons, women may be less likely to work.

Worker growth is outstripping general population growth in East London

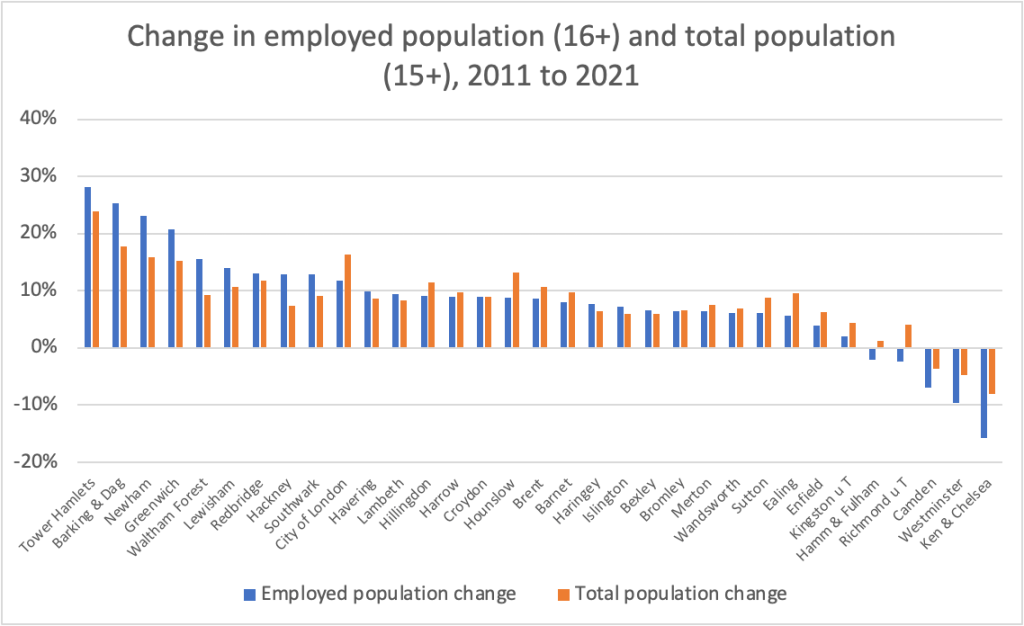
Between 2011 and 2021 London’s working adult population aged 16 and over and its total population aged 15 and over both rose by around 8.5 per cent. But growth was very unevenly distributed (see chart below).

The east London boroughs have seen rapid increases and in most cases their working population growth has outstripped their general population growth. Other boroughs, particularly in other parts of north and west outer London, have seen their working population grow more slowly than their overall population, and a handful of west-central boroughs have seen a decline in both groups.

Taken together, these figures suggest that London continues to contain extremes of employment and worklessness. Zooming into the ONS’s detailed map, you can find blocks where 15 per cent or more of people aged over 16 are unemployed and looking for work within boroughs that have grown their workforce by 25 per cent over the past ten years.

Londoners are unquestionably working hard. More women, more older people and more disabled people are in the workforce. To what extent this is a result of making positive choices and the general industriousness of urban life, and how far it is driven by the exorbitant costs of living in the capital is another question.

Originally published by OnLondon.

Re-do the Strand

Some cities do winter merriment better than others. They have the Christmas markets, they have the gluhwein, they have the blankets and hot chocolate outside ornate cafes. London is not like that. London’s winter life is interior: it’s the “the pubs and the bookies where you spend all your day”, as the Pogues’ Shane McGowan put it. All the more kudos then to the new Strand Aldwych public space scheme, which opened to the public last month.

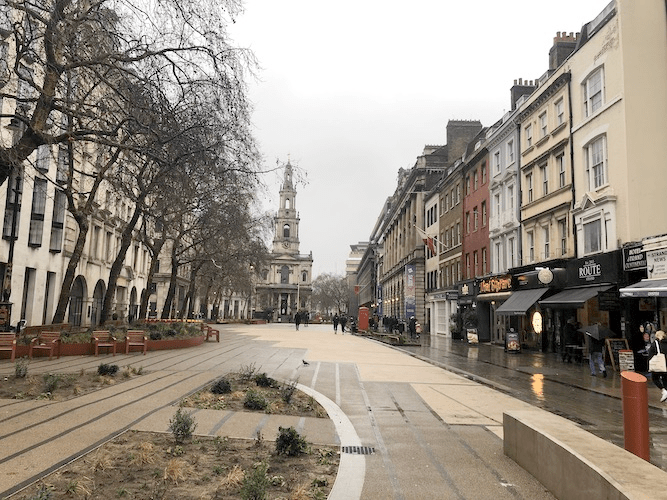
Image of public space from the west

Aldwych’s arc marks as abrupt a transition as any in London. To the west, Covent Garden and theatreland, to the east, universities, lawyers, consultants and bankers. It has a rich history – Aldwych was at the heart of the post-Roman city of Lundenwic – and fine buildings, including Marconi House and Bush House (birthplace and nursery of the BBC) and St Mary le Strand Church. But Aldwych and its hinterland can easily be shrugged off as an interspace, between the cities of London and Westminster, rebranded as Midtown or Northbank, identified by what it is not.

It was terrifying too. The traffic tearing round the gyratory made Aldwych and Strand a glorified roundabout, where pedestrians and cyclists risked their lives darting between buses and taxis. It was no place to linger.

The Strand Aldwych project is designed to change all that. In 2014 Northbank Business Improvement District, led by Ruth Duston, appointed research and urban design specialists Publica to rethink the public spaces on their patch, and then to develop the idea of reinstating two-way traffic on Aldwych, thereby allowing around 200 metres of Strand to be pedestrianised between Bush House, King’s College and Somerset House.

Traffic plans were refined, project boards set up, stakeholders engaged, options reviewed, visions workshopped, artists involved, traffic orders drafted, “meanwhile uses” planned and consultants appointed – including LDA Design – who led the Games-time and legacy landscape design of Queen Elizabeth Olympic Park – as lead designers of the new public spaces.

In 2020 Westminster City Council allocated funding for traffic rerouting and new public space. Works commenced in January 2021, with Strand closed to motor vehicles between Waterloo Bridge and Surrey Street from September of that year. From conception to opening the scheme took around eight years – lightning fast in London terms.

The new public space, which is (of course) “the size of a football pitch”, is divided into two by St Mary’s, an elegant early Baroque building whose vicar was enthusiastically welcoming visitors the afternoon I visited (and which has a ‘Sound and Light Installation’ explaining its history until the end of February).

Nighttime image of the public space from the east

To the east, between the King’s Strand Campus and Bush House, there are benches interspersed between flowerbeds and new street trees, and a slightly scruffy lawn in front of the church. A few cars and vans are still allowed in for servicing and for a hotel car park, with sliding bollards to control access. Watching these glide is hypnotic, though the paint scalps on their flanks suggest they have already encountered some over-confident drivers.

West of St Mary’s is a more expansive space in front of Somerset House formed of stripes and slabs of differently toned asphalts, feeling almost oversized. Tables and benches for summer carousing sit to one side – it will be interesting to see what rules will be applied – and spindly coloured chairs are bolted to the tarmac in a slightly awkward row, as if hanging around on the fringes of a teenage party. It is a stage waiting for a show and has been made big enough to accommodate temporary pavilions and installations.

But even on a grey January afternoon, with the temperature hovering close to freezing, these new spaces are busy. Students and workers sit around the church, chatting, smoking, eying phones and laptops. Cyclists weave between bollards (there has been some criticism of a lack of segregated cycle routes) and walkers saunter through the square with boulevardier relish rather than with the pace and momentum that drives most London journeys on foot.

Precise numbers are hard to come by, but I get the impression that the traffic rerouting took most of the budget. That is to say the landscaping, though well-designed, is functional rather than sumptuous. The flower beds and benches are edged by brown-painted steel, perhaps intended to look like costlier CORTEN from a distance, and most of the road surface is asphalt rather than stone paving.

This is not really a criticism. City centre spaces need to be robust and flexible rather than perfected and fragile, and Westminster City Council has already copped some criticism (including from Westminster Labour before they took over the Council in May) for spending money here rather than in needier parts of the borough. The expanses of tarmac can give these new spaces a bare look, more like the road they used to be than the public piazza they are becoming. However, the 45 new trees and 2,000 square metres of planting will soften them over time, as will more people spilling between the buildings as the days lengthen.

And I think they will come, drawn by temporary events and artworks such as Nick Ryan’s ‘The Voiceline’ – an audio installation drawing on 100 years of BBC archives – by new perspectives on previously half-glimpsed buildings and by the chance to watch the amazing gliding bollard show (or perhaps that’s just me).

The scheme creates a peaceful and breathable space, a pause on one of London’s major crosstown routes and an open-ended quadrangle for King’s College,   though it is a shame that, unlike other London universities, the King’s campus remains sealed off from passers-by.

My only remaining kvetch, which has dogged me in almost every paragraph of this piece, is that there doesn’t seem to be a name for the space or spaces. ‘Strand Aldwych’ is the project, and ‘Strand’ refers to a longer road. Is this to be Strand Place, Bush House Plaza, King’s Court, St Mary’s Walk? We need a name we can complain about, adapt and eventually adopt, for this well-conceived and promising new piece of city.

First published by OnLondon.

Drifting back

After the turbulence of recent months, many Londoners will be hoping for a return to normality, albeit under the shadow of a cost-of-living crisis and a looming recession. But is the city’s office economy returning to pre-pandemic patterns of commuting and working, or have we settled into a “new normal” of hybrid working, empty office blocks and diminished city centre businesses?

London’s streets certainly seem busier, and on the days that they are running, so do London’s tube trains. This is borne out by Transport for London data: trip volumes have been increasing since the summer and now average around 80% of pre-pandemic levels. There are some spikes and dips to this trend, (such as Jubilee celebrations and bank holidays elevating usage, and strikes and heat waves reducing it), but Tube use is now just 20% below pre-pandemic levels.

Screenshot 2022 11 13 at 22.06.03

There is a persistent rhythm emerging too. Weekends are still busiest, with nearly 90% of pre-pandemic trips. Monday, Tuesdays and Fridays are quieter with averages of 65-70%, and Wednesdays and Thursdays slightly busier with averages of 70-75%. However, since the beginning of September, the recovery in trip numbers has been particularly sharp around the City of London and Canary Wharf, suggesting that an increasing proportion of passengers are office workers, as opposed to leisure visitors or workers in other sectors.

Other figures confirm the impression of a gradual return to offices. Remit Consulting have been collecting data on office occupancy throughout the pandemic, based on access control systems (swipe cards and so on) from a sample of around 150 large office buildings in the UK. After advice to work from home was lifted at the end of January, office occupancy figures rose quickly to around 25% and stayed at that level throughout the summer, but since the beginning of October have climbed above 30%.

Screenshot 2022 11 13 at 22.08.27

Remit estimate that “normal” office occupancy levels were 60-80 % before the pandemic, so 30% occupancy in fact equates to offices being around “half full” on the average day. Remit also have a more detailed breakdown by London office ‘submarket’ which shows West End offices back to around 42% average occupancy in October, with City and Docklands offices lagging behind.

Further west, in the SW1 corridors of power, offices are busier. When Jacob Rees-Mogg told civil servants to return to their desks in April, there was an immediate, but amusingly short-lived, effect on behaviour. Office occupancy leapt up from a departmental average of less than 50% of capacity, hitting 65% in mid-May, but had fallen back again by the end of that month.

Jubilee celebrations, summer holidays and industrial action kept numbers low over the summer, but occupancy has been back above 65% since the beginning of October. This is not far off pre-pandemic levels – though to be fair there have been an awful lot of ministers to clap in and out of Whitehall offices over the past few weeks.

While the higher levels of civil service return may reflect a tougher line from ministers, it seems that the return to offices has in fact gathered pace just as politicians and newspapers stopped demanding it. But it remains a trickle rather than a surge. Where do we go from here?

Many workers welcomed more flexible working, and are keen to retain its benefits. The survey commissioned by Kings College London this spring as part of their Work/Place project (on which I worked) found London workers embracing hybrid working patterns enthusiastically: 61% reported hybrid working, defined as working from home at least one day a week (compared to less than 20% before the pandemic). A further 13% worked only from home.

Workers expected the changes to stick too: 75% said they were “never going back” to a five-day week in the workplace, with three days a week at home the most popular option. The results of a second phase of the King’s survey (undertaken in the summer) are due to be launched at a joint event with Central London Forward next week, so we will have some idea of whether these views have shifted over time.

But there is a big difference between these workers’ expectations and those of employers. The UK-wide Business Insights and Conditions Survey found that the proportion of employers (weighted by employee numbers) planning to use home-working as a permanent part of their business model rose from 16% in October 2021 to 24% in May 2022. It was much higher in the ‘office-based’ sectors (professional, scientific and technical services, and information and communications) that account for around one in five London jobs.

However, in the latest wave of the survey (August 2022) that proportion appears to have started to fall across the board, suggesting that bosses may be becoming cooler about long-term home-working (a finding which seems to be mirrored in trends tracked by the WFH Project, a consortium of north American universities).

Screenshot 2022 11 13 at 22.10.53

This gap between employer and employee expectations suggests that we have not yet reached equilibrium. Hybrid working certainly poses challenges – both for planned communication within and between organisations, and the “watercooler moments” of serendipity and casual interaction that form the foundations for corporate culture. Mixing digital and real-life interaction is tougher in many ways than the world of universal home-working during the pandemic.

Over time, new ways of working may diminish or overcome these challenges – through enhanced technology, or changes in culture or behaviour. Managers may tighten rules to ensure that teams can meet effectively and to prevent working from home becoming a perk for those with the privilege of controlling their own workflow (at the moment, it is overwhelmingly concentrated in more senior managerial and professional roles), or conversely to prevent a culture of office attendance and preferential treatment for those (mainly male) workers without caring responsibilities.

But as the recession bites, employers may feel emboldened to push for more presence in the office. There are already stories of companies such as Meta (formerly known as Facebook) retreating from the highly permissive approach they took during the pandemic, and some bosses may share Elon Musk’s views about home-working if not his cack-handed approach to employee relations. Even if returning to the office is not mandated, the threat of redundancy may boost presenteeism although, alternatively, tighter economic times may push employers to seek savings on property costs.

There may also be some polarisation: primarily remote working may become the norm in some sectors or companies, while being in the office becomes more established in others. The King’s College research showed that the biggest increase in home-working was among those who were already working from home at least one day a week before the pandemic.

Where more people are in the office, “fear of missing out” – on advancement, on collaboration, on gossip – may draw even more people in. Conversely, where online meeting and collaboration tools are the norm (perhaps augmented by periodic spells of intense in-person collaboration), employees will respond accordingly – not just in their daily habits, but in long-term decisions about where they live.

London’s office economy has not yet returned to its pre-pandemic state, but nor do I think it has settled into a “new normal”. Huge challenges for the real estate sector and the ecosystem of city-serving businesses remain, and some of these will be discussed at the King’s College/CLF event next week. But the future looks less bleak than it did during the pandemic, and any case for stripping back transport seems much weaker than it might have done even a few months ago. The debate about Crossrail 2 even seems to have restarted. Reports of London’s demise look to have been premature at best.

Originally published by OnLondon.

Housing risks are multiplying

Fiscal, political and financial events are coming at us pretty fast right now, so it is easy to feel disorientated. But as the screech of U-turns fades and the smoke of burning policies clears, we already seem to be in a world that has fundamentally shifted from the stability of more than a decade of low interest rates.

Bank of England base rates, which have been below 1% for nearly 15 years, are already above 2% and some forecast they will rise as high as 6% next year (though expectations may be starting to fall, following the Chancellor’s latest statement). Mortgage rates have shot up too, with fixed-rate offers already jumping from 2% to more than 6%.

It is true that interest rate rises were already expected, but the chaos following the previous Chancellor’s “fiscal event” in late September means rises have been faster and sharper than most anticipated. What does this mean for the capital?

There’s not much good news, I’m afraid. Firstly, according to the Resolution Foundation, costs will rise sharply for those households whose fixed rate deals come to an end soon. A total of 5.1 million households nationwide – around 60% of all households with mortgages – have deals that run out before the end of 2024.

Londoners in this group will face the steepest rises, with average annual costs rising by £8,000. The capital has the lowest proportion of households with mortgages in England, but even so, there were around 1,000,000 mortgaged households in London in 2020, so around 600,000 of those could be facing a huge hike in the costs of their mortgages, assuming exit from fixed rate deals mirrors the national pattern. The impact will be selective but brutal.

At the same time, house prices are widely expected to fall – and to fall faster in London than elsewhere – as rising mortgage costs delay purchases or even force some sales. The top of the market is still booming, but there are dark clouds on the horizon. Some analysts have predicted London prices falling by as much as 12% by the end of 2024.

At first sight, this looks like it could be good news – at least for first-time-buyers, who paid an average of £440,000 for London properties last year. If those predictions of a 12% price drop were borne out across the market, this figure would fall to £387,000 by the end of 2024 and imply a (10%) deposit of £39,000 rather than £44,000. Together with the impact of Stamp Duty reductions announced in the ill-fated “mini-budget” – still standing at the time of writing, but anything could happen – this would reduce cash move-in costs by around £10,000.

But the impact of this possible saving would be rapidly wiped out by higher mortgage costs. The monthly cost of a 90% mortgage on a £440,000 property is around £1,777 on the basis of a 2.5% interest rate. If and when rates rise to 5%, even a £387,000 property would cost £2,036 per month – £250 more than now, and around two thirds of take-home pay for someone earning £50,000 a year.

For those buyers lacking the family wealth or savings to afford a deposit, falling prices and stamp duty cuts may help a first tentative foot onto the ladder. But the burden of those higher mortgage costs will soon wipe out those savings. Behind every silver lining, another cloud.

With a sharp fall in property values comes the threat of “negative equity”, a thoroughly unwelcome revival from the tail end of the last century. Negative equity – a term to describe when the value of a home is lower than the mortgage secured against it – was estimated to have hit around 40% of properties in London in the early 1990s.

A recent report by property analyst Neal Hudson suggests that a 20% fall in property prices would put 10% of London mortgages in the red. Again, the figure is higher than for other regions because prices in the capital have grown relatively slowly over the past five years, meaning recent buyers have had less chance to build up a buffer of equity.

Although negative equity is unpleasant and unsettling, it only becomes an acute issue if you are seeking to sell or remortgage a property. However, rising mortgage costs could force some sellers’ hands, particularly London’s newest buyers, who are those most stretched in terms of affordability and least cushioned by historically rising prices.

Private sector renters have it tough as well: rents are surging as landlords seek to pass on rising borrowing costs and as competition for properties intensifies, partly driven by a post-pandemic bounce. Some central London letting agencies already report more than 80 enquiries for each rental property, up from 16 in September 2019. As people delay purchases or – in a worst case scenario – see mortgaged properties repossessed, demand for rentals is likely to increase.

Something, you feel, will have to give. There will come a point when landlords will be unable to pass rising costs on to tenants or tenants will simply be unable to pay. Landlords may be forced to sell, as will some first-time buyers, which could feed a spiral of declining property values. Again, this has its attractions but raises the question of who will be able to buy when interest rates remain high?

London property prices may be overdue a correction (that is, a fall), but while interest rates continue to rise, it will be London’s private renters and first time buyers who will be most at risk of losing their home. Sadiq Khan has already renewed calls for rent controls and more funding for affordable housing as market supply stalls.

After the 2008/09 financial crisis a “mortgage rescue scheme”, administered in London by the previous Mayor, allowed housing associations to take a stake in properties to avoid repossessions. It had limited take-up in London and was closed early. But in a city that already has four times the national rate of homelessness, government action may again be needed to soften the blow.

Originally published by OnLondon.

There may be trouble ahead…

One of the grimmer expectations as sizzling summer gives way to apprehensive autumn is that we seem to be heading into a recession. But what sort of recession will it be? To paraphrase Tolstoy, even if all economic booms are alike, every recession is unhappy in its own way. How did London fare in recent recessions, and what could that tell us about the city’s prospects over the next couple of years?

1990-92 – from negative equity to currency speculation

The early 1990s recession technically ran from autumn 1990 to autumn 1991, though it cast a long shadow. It was triggered by rising inflation in the late 1980s, leading the government to put the Bank of England base rate up from around 8% in summer 1988 to nearly 15% in summer 1989 – nearly ten times its level today. Though the base rate came down steeply in the following years, it was still 10% in late 1991.

By this stage, the UK housing market was in freefall. Prices dropped by about 20% nationwide, and the fall was particularly sharp in London and the wider south east – around 30% between late 1988 and early 1993. A similarly sharp crash hit commercial real estate. The 1992 bankruptcy of Olympia & York, developers of Canary Wharf, was one of the most prominent collapses, throwing the planned Jubilee Line extension into doubt in the process.

The late eighties had seen a residential property boom, fuelled by right-to-buy, tax relief on mortgages and pretty lax lending criteria from banks. As prices plunged and mortgage costs rose, many new homeowners ended up with “negative equity” – property worth less than the debt secured on it. A study by economic geographer Danny Dorling estimated that around 40% of Londoners who bought homes in the late 1980s found themselves in this position – the highest rate in the UK. In some parts of east London, the proportion was more than 60%.

London’s workforce also suffered badly. In 1990 the unemployment rate in London was around 6.5%, the same as in Britain as a whole, but by 1994 it had doubled to 13% compared to 10% nationwide. Rates converged slightly in the following years, but London’s unemployment rate has stayed above the national level ever since. One analysis has suggested that factors driving higher unemployment in the capital included employers moving out of the city, high rates of closure in the manufacturing sector, and an increasing tendency for specialised sectors to recruit workers from outside the M25.

Screenshot 2022 08 23 at 17.23.45

A curious turning point in London’s economic fortunes was reached in September 1992, when the UK was forced to leave the exchange rate mechanism (ERM), a precursor to the European single currency, which had required the government to use interest rates to maintain sterling’s value against other European currencies.

As speculation against the pound intensified, the government tried to compete with the speculators by buying sterling and by temporarily putting interest rates back up to 15%, before throwing up their collective hands and leaving the ERM. The value of sterling and interest rates then fell quickly, with the latter reaching 6% by the end of the year, and staying between 3% and 8% until 2008. With relatively low interest and exchange rates, the UK in general and London in particular suddenly looked like a great destination for overseas investment. The stage was set for the 15-year boom that followed.

2008-09 – from credit crunch to quantitative easing

The 2008-09 recession was very different in character and impact. The main trigger for the recession was the “credit crunch” – a sharp reduction in banks’ willingness to lend as they realised that many of them had bought high-risk subprime mortgages, which were starting to default. Because of the way these mortgages had been bundled up the banks didn’t even know how exposed they were. This screeching halt to a lending boom hit the housing market, with knock-on effects on consumer spending and confidence.

As concerns about unidentified “nasties” sent bank shares plunging (dragging the rest of the stock market with them), the government stepped in with a £500 billion programme of loans and guarantees to keep the money moving in the UK banking system. Interest rates – by this time set by the Bank of England – were also reduced sharply to try to return liquidity to lending, falling from 5% in April 2008 to 0.5% a year later. And, like other central banks around the world, the Bank of England also began to buy up government bonds, thereby injecting more cash into the economy for lending and investment (“quantitative easing”).

The immediate impact of the financial crisis was highly visible in London, and commentators expected this “white collar recession”, which had its roots in irresponsible lending by the financial sector, to hit London hardest. In September 2008, the collapse of US bank Lehman Brothers provided schadenfreude-fodder TV footage of stunned-looking bankers leaving their Canary Wharf offices with cardboard boxes of belongings. Immediate job losses in banking were substantial: GLA analysis identifies a net reduction of 30,000 in financial services in 2008-09.

But London proved resilient: overall job numbers in the capital fell faster than in the rest of the country, but also recovered more quickly. Unemployment peaked at 10%, but that was much lower than in 1993. House prices also dipped sharply, falling 15 per cent in London in the year to May 2009, but had recovered to their 2007 level by 2011, three years sooner than that happened in the UK as a whole. Asking “How did London get away with it?”, Professor Ian Gordon of the London School of Economics has observed that the recession affected different classes in different ways: lower-paid administrative and manufacturing workers took a heavy hit, while professionals and people working in service sector jobs supporting them saw much lower job losses over time.

One reason for this, Gordon suggests, is that the package of support provided by the government helped to revive professional services, particularly through diverting investment from bonds into property and shares. In addition, while London’s construction sector took a hit, both the London 2012 Olympic and Paralympic Games and Crossrail were major programmes of public works that sustained demand. It is, of course, arguable whether London’s rapid recovery from 2010, closely tied as it was to soaring property costs, was good for the city as a whole or has acted as a brake on productivity and equity – but that is probably for another day.

2022-?? – prospects for the capital

So, does the coming recession look more like 1991-92 or 2008-09? Worryingly for London, it may resemble the former more that the latter: interest rates and inflation are rising rather than falling (and GLA research suggests that Londoners face particularly high inflation). Private renters are already facing steep rises according to some reports, and London’s owner-occupiers may struggle when fixed-rate deals come to an end: average mortgage debt in London was about 60% higher than across the UK according to a 2017 survey, and the capital has many more borrowers with high loan-to-income ratios. Meanwhile, after a boom in demand for higher quality office space, rising interest rates and energy costs, alongside persistently high levels of home-working, are chilling the commercial real estate sector.

Furthermore, it is hard to see where new money will come from to reignite London’s economy. Quantitative easing has ended (indeed, the Bank of England is contemplating reversing the process), new transparency rules may make London a less favourable destination for (shady) foreign investors, and Transport for London is haggling with government to sustain services rather than gearing up to deliver new infrastructure.

However, for the moment, the economy still seems relatively buoyant. The number of jobs in the capital grew by around 100,000 between March and June this year, and unemployment is falling (even if, intriguingly, more people are dropping out the labour market than entering work). And London continues to top league tables of popular cities for business, from finance to tech (ironically, the sector that powered remote work seems particularly focused on office location).

London’s resilience can emerge from surprising places, as it did in the 1990s when recovery took root in places such as Hoxton and Shoreditch that had been been laid low by recession. There may even be shafts of sunlight behind the clouds. Nobody wants to see a return to negative equity, but a medium-term correction to commercial and residential property values might actually make London more accessible as a place to live and work.

There may be trouble ahead, but London still has the diversity of people and place, the heritage and culture, the transport connections and restaurants, that make it one of the world’s greatest cities. It may be politically and economically difficult to commit major investment in the capital, but the government should at least avoid damaging the social, housing and transport infrastructure that will enable London to lead national recovery after the recession.

First published by OnLondon.

Baby bust and boomer boom – first thoughts on the 2021 census

The 2021 census, conducted in March last year, will forever be a strange record of a strange time – hard to interpret but fascinating for what it doesn’t tell us as much as for what it does. The first results, covering broad population figures, came out in June, and further detail will emerge in the coming months and years, with more expected in the autumn.

The census was already the subject of intense political debate because, as On London has reported, census figures underpin funding formulas for everything from schools to fire services. Undercounting London’s population may rob our public services of resources even as the cost of living crisis deepens.

Past censuses have been criticised for missing many Londoners, for example undocumented migrants who may be unwilling or unable to complete official forms. In 2021 there was the added impact of the pandemic: city-flighters, students stuck at home, hopeful immigrants and emigrants stymied by travel restrictions.

So we should be cautious when looking at London’s census results. But what do they tell us about how London is changing – from cradle to care home – compared to the rest of the country and compared to previous decades?

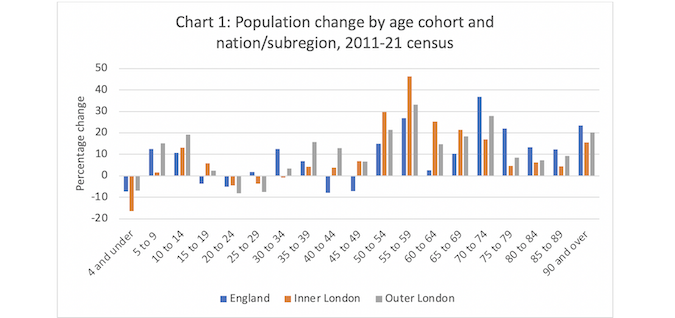
The two charts below summarise the numbers. The first compares the 2011-21 population changes for inner London, outer London and for England as a whole.

Screenshot 2022 08 16 at 19.03.09

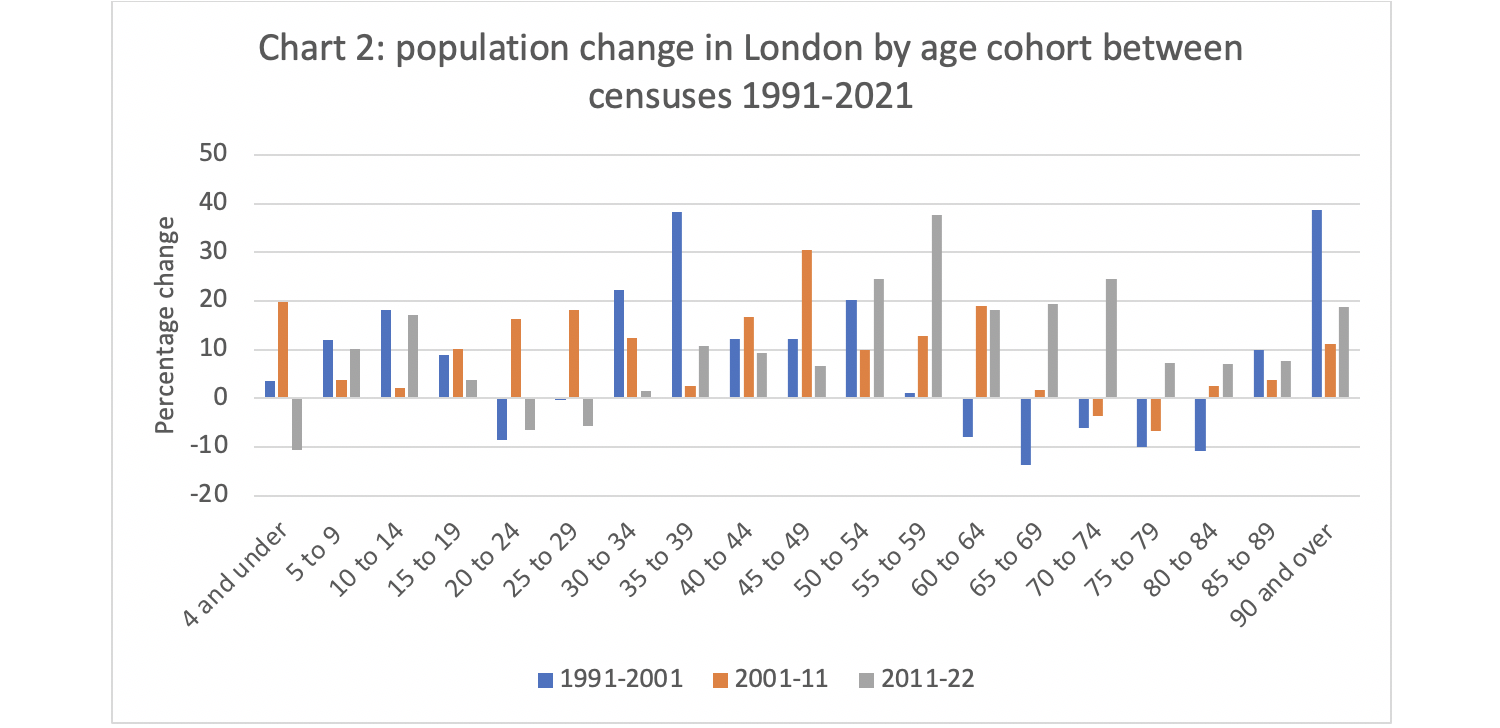
The second puts these changes in context by comparing the last decade in London with the findings for the capital of the previous two censuses.

Screenshot 2022 08 16 at 19.05.34

Here are five conclusions that can be drawn.

One: Baby boom and bust spells turbulence for education authorities

London had a baby boom between 2001 and 2011, adding more than 100,000 under-fives (a 24% rise in the age cohort). This was reversed in 2011-21, with the numbers of under-fives dropping particularly fast – by 16% in inner London.

Some of this change may be the result of young families moving out temporarily during the pandemic but, as  Greater London Authority demographers have explored, the birth rate more or less peaked around the time Boris Johnson started boasting of a London 2012 conception bonanza and has fallen back since then.

This makes planning school places fiendishly complicated: while demand for primary places fell in most of inner London, the outer H-boroughs (Harrow, Hillingdon and Hounslow) saw some of England’s highest growth rates for primary age children. And as the 2000s baby boom fed through, the secondary school cohort has grown much faster: Barking & Dagenham’s 10-to-14-year-old numbers grew by 43%, the fastest in England, with Hounslow, Richmond and Tower Hamlets close behind.

Two: London’s loss of young people was rural counties’ gain – at least temporarily

Between 2001 and 2011, 15 to 30-year-olds accounted for a net growth of around 300,000 people (around a third of London’s total net growth), reflecting the city’s magnetic pull for young people seeking to study, work or simply enjoy their lives. This contrasts with the overall stagnation in that population group in the previous census period spanning 1991 and 2001 and what looks like an almost comical reversal of the early century trend between 2011 and 2021. Rather than flocking to London, twenty-somethings seem to have headed down some deep country roads. For example, Test Valley, East Devon, Maldon and Harborough have seen the biggest rises in their numbers of 25 to 29-year-olds.

Some of this probably does reflect long-term relocation to new hipster heartlands of the West Country and the Kent and Sussex coasts, driven by soaring London rents and the ever-wider availability of flat whites. But I suspect that much more of this apparent exodus has already reversed, as young people who moved back to parental homes during the pandemic or began their university studies online have returned to larger towns and cities. The GLA’s helpful guide to the census uses payroll data to show just how many early-twenties workers left the capital during the pandemic and came back in autumn 2021.

Three: London’s boomers are booming

London’s middle-aged population (yes, including “Gen X”-types as well as “Boomers”) has soared, seeing some of the highest growth rates in England. The number of 55 to 59-year-olds in inner London grew by more than 45%, including by around 60% in Southwark, Lewisham and Lambeth. This contrasts sharply with England as a whole, where this age group grew by a more modest 27%. The London growth is also much faster than in previous decades: the 55 to 59-year-old population increased by 13% between 2001 and 2011, and by a negligible 1% the previous decade.

Some of this probably has its roots in London’s rapid growth of 35 to 39-year-olds in the 1990s, though of course there will have been plenty of churn between the census years. But it is interesting to consider why this generation may have chosen to stay in the city – and in inner London in particular – a rather than moving to the suburbs or a Home Counties village.

This was a generation that was able to benefit from relatively low house prices in the early 1990s following the property crash at the start of the decade. As mortgages are paid off, properties that were bought for tens of thousands of pounds are now valued at ten times as much. At the same time, since the pandemic, there has been a nationwide fall in the number of over 50s in the labour market.

It’s too early to join the dots convincingly between these trends – to say confidently why the numbers of middle-aged people have risen so fast in inner London boroughs. But we can speculate. Is this a “boomer belt” of reasonably well-off homeowners? People who may have stopped working and don’t feel the same financial pressures as younger Londoners in precarious housing, some of whom don’t see any great urgency in building more houses in established neighbourhoods? Interestingly, Brighton and Hove, which has similarly high housing demand and constrained supply, has seen a very similar demographic shift over the past decade.

Such stability makes for liveable neighbourhoods and lively local shops, cafes and restaurants. But at what price? If high prices and low supply squeeze younger and poorer people out of the inner city neighbourhoods, or even block them from moving there in the first place, stability may be at the cost of vitality and – in the longer term – economic productivity.

Four: London is ageing, even though not as fast as we thought

If London’s boomers stay in the city we will also see a big bulge in the older population when we come to review the 2031 census. Over the past ten years, London’s sixtysomething population has grown a lot faster than the English average. Among the over 70s, growth has been slower, though boroughs such as Waltham Forest and Redbridge have been closer to the national average.

As the GLA predicted, the census figures showed that previous estimates had over-done the size of London’s elderly population. However, growth is coming, and as today’s 60-year olds enter their seventies around the time of the next census, there will be a corresponding growth in demand for health and care services, making their currently dysfunctional funding and management an ever more urgent issue for London. It will also bring into sharp focus the issues of specialist housing for older people that were explored by my former Centre for London colleagues last year.

Five: Something was happening in 2021, but we don’t yet know what it is

The pandemic was probably more disruptive for London than any event since the Second World War (when no census took place). While its impacts were not as cataclysmic for city living as some predicted, we still don’t know what the long-term effects will be on working patterns or on how and where people choose to live. Nor do we know how new immigration arrangements, political change and the looming recession will affect the capital.

There may be a case for a mid-term census in 2026, as suggested by economic geographer Danny Dorling. But London will undoubtedly need to draw on data from the latest census and beyond to understand the city, who it is working for, and how it is changing.

First published by OnLondon.

Into the red

Levelling up has stalled, according to IPPR North’s latest analysis of public expenditure figures. The think tank’s press release highlights a 25 per cent real terms rise in spending per person in London between 2018/19 and 2020/21, compared to 20 per cent across England and 18 per cent in northern regions. IPPR North Research Fellow Ryan Swift said, “Our analysis suggests that levelling up was, in many ways, business as usual.”

These expenditure comparisons are a regular feature of regional inequality discussions, and are a pretty poor measure at the best of times. In every region, they aggregate places of great wealth and poverty. They also mix expenditure that represents investment in public services and infrastructure, with expenditure on welfare payments and support where local communities and economies are struggling. Everybody would want more of the first, but to need less of the second.

Transport spending figures are particularly contentious. While IPPR North research has repeatedly pointed to higher transport spending in London when arguing for more funding, Greater London Authority analysis from 2017 argued that, while London’s public expenditure on rail is high if compared to its resident population, it is much lower than the Midlands and North if compared to the number of journeys taken on it (with similar comparisons for expenditure on roads).

The pandemic has made such comparisons even more problematic. As both IPPR North and the Office for National Statistics (ONS) note, 2020/21 expenditure figures include huge sums spent on coronavirus support schemes such as furlough, self-employment support and business loans, all of which saw very high take-up in London, which has a bigger economy and many more jobs than any other region. But even when you take these costs and health spending out of the equation, IPPR’s analysis still shows London with eight per cent growth over three years, compared to three per cent across England and two per cent in the North.

What accounts for the rest of the increase? Welfare and transport primarily, according to the ONS analysis. Unemployment-related benefit claims shot up much faster in London than in the rest of England as the economy went into hibernation in 2020, as reported by Centre for London. And the capital city’s public transport system saw a devastating loss of fares revenue, relying on short-term government handouts to remain solvent. Far from being a sign of favouritism, this boost to spending in London is a symptom of a capital city on life support as the pandemic laid waste to its economy.

Extraordinary responses to extraordinary circumstances should be temporary, so the expenditure gap between London and other UK regions should narrow in coming years. But it is the other side of the fiscal balance sheet that should worry us all in the longer-term. Alongside increases in expenditure, taxes raised in London fell by £6.7 billion in 2020/21, with business rates accounting for nearly half that reduction, followed by VAT, stamp duty and air passenger duty. In 2019/20, London made a net contribution (total revenues minus total expenditure) of £40 billion to the UK; in 2020/21 London had a net deficit of £7 billion – the lowest deficit in the UK, but still a dramatic change in fortunes.

From this perspective, the pandemic has in fact closed the gap between the UK regions, but only by levelling London (and the South East) down. So we should be careful what we wish for as we emerge from the coronavirus crisis into a new age of economic instability. Yes, London should be arguing for the government investment in green jobs and neglected infrastructure that will help northern regions realise their potential. But all of us should also be making the case for supporting London’s economy, so that the UK’s premier global city can once again generate the revenues that will help turn these aspirations into reality.

First published by OnLondon.

9 to 5?

With Cristian Escudero

How many people are working from home, and how many have returned to the office? The answer to this – apparently simple – question is surprisingly complicated.

Estimates have varied – as the pandemic has waxed and waned, as government guidance and regulation has changed, and as different surveys have asked subtly different questions. As part of a new project at King’s College London, Work/Place: London Returning, we have been comparingthe different surveys and what their results tell us, alongside our own Wave 1 Work/Place survey of London’s workers. 

Although the headline figures emerging from the various surveys have varied, one feature has remained consistent throughout: London’s experience has been different to the rest of the UK’s. The capital saw more people furloughed at the beginning of the pandemic, and has persistently had more people working from home. For example, in its 2020 round of interviews, the Office for National Statistics (ONS) Annual Population Survey (APS) found that 37 per cent of London’s workers had worked at home the previous week, compared to 26 per cent across the UK. In January to March 2021, the ONS Opinion and Lifestyle Survey found that up to 65 per cent of Londoners and 46 per cent of people across England had worked from home as a result of Covid the previous week. In late March 2022, the same survey showed that around 26 per cent of the UK population worked from home, while 37 per cent of Londoners did. Most recently, in July 2022, ONS analysis showed London had seen sharper rises in homeworking, and bigger drops in commuting from out of region, than any other English regions between late 2019 and early 2022.

Remote working has always been more prevalent in London: APS data shows that 18 per cent of London’s workers had worked from home in the week prior to interview in 2019, compared to a UK average of 12 per cent. But why are people who live and/or work in London (the groups are similar but not the same) so much more likely to work from home, and are they likely to return to the office over time?

There are some factors that enable London’s workers to work remotely and there are others that encourage them to do so. More London workers can work remotely because of the industries they work in. As our paper sets out, many more Londoners work in professional services, and information and communications roles – for example, as lawyers, accountants, consultants, TV producers, IT consultants, architects. These jobs accounted for 22 per cent of London employment, but only 14 per cent across England. These were also the jobs that switched online most easily: in January 2021, employers in England estimated that 44 per cent of professional services workers and 59 per cent of information and communications workers had been working from home in the previous two weeks.

By contrast, in sectors such as hospitality – which rely heavily on face-to-face contact and account for a similar proportion of jobs in London and across England – nearly 75 per cent of staff were on furlough at that time. London’s workforce split between the workers who took their work home, and the workers whose work vanished as commuters and tourists stayed away, which also explains why the capital had both the most resilient productivity, and the highest rises in unemployment during the pandemic compared to other English regions.

Industrial structure accounts for some but not all of the difference. The effect is compounded by occupational structure: 62 per cent of Londoners worked management, professional or associate professional jobs in 2021, compared to 50 per cent across England. Around 40 per cent of people doing these jobs worked from home for at least one day the week before they were interviewed in 2020, compared to caring, skilled trade and customer service jobs, where 10 per cent or fewer reported doing so.

These features of London’s workforce help to explain why Londoners and London’s workers (overlapping but distinct groups) can work from home; the Work/Place survey also sheds light on why they are choosing to do so – at least some of the time. The survey found that the costs of commuting, and the time it takes, were the leading factors behind home-working. While respondents valued the flexibility of working from home, they did not dislike their office environment – on the contrary, many valued the sociability and buzz of their London workplace – but disliked the time and expense of daily commuting.

Commuting is a big cost – in terms of time and money – for people living and working in London. Labour Force Survey data for London boroughs showed their residents commuted an average of 39 minutes each way in 2016, compared to 28 minutes for other English local authorities, and showed similarly lengthy commutes for people living in commuter districts such as Chiltern, Dartford and Elmbridge. One London PR agency has estimated that commuting can cost £8,000 or more every year, when additional childcare costs are added to season ticket costs – equivalent to 22 per cent of the average PR salary after tax.

London workers have both the capacity and incentives to work from home, at least some of the time, and the fact that leisure visits have been recovering faster than workplace visits suggests that it is long-term changes in habits rather than short-term fear of infection that is influencing behaviour. Against this backdrop, it is unsurprising that our Work/Place survey found that only a minority think that the five-day commute will return. For the moment, the preference seems to be for hybrid working, with around 45 per cent of London workers viewing two to three days working from home as optimal. Culture and practice will shift the dial one way or another in specific organisations and industries, as would government action on the costs of commuting and childcare, but our research suggests that the impact of the pandemic on London’s work patterns has been significant and will be long-lasting.

First published by Kings College London.