Baby bust and boomer boom – first thoughts on the 2021 census

The 2021 census, conducted in March last year, will forever be a strange record of a strange time – hard to interpret but fascinating for what it doesn’t tell us as much as for what it does. The first results, covering broad population figures, came out in June, and further detail will emerge in the coming months and years, with more expected in the autumn.

The census was already the subject of intense political debate because, as On London has reported, census figures underpin funding formulas for everything from schools to fire services. Undercounting London’s population may rob our public services of resources even as the cost of living crisis deepens.

Past censuses have been criticised for missing many Londoners, for example undocumented migrants who may be unwilling or unable to complete official forms. In 2021 there was the added impact of the pandemic: city-flighters, students stuck at home, hopeful immigrants and emigrants stymied by travel restrictions.

So we should be cautious when looking at London’s census results. But what do they tell us about how London is changing – from cradle to care home – compared to the rest of the country and compared to previous decades?

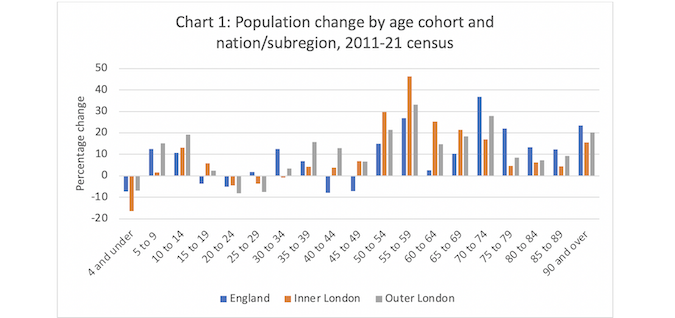
The two charts below summarise the numbers. The first compares the 2011-21 population changes for inner London, outer London and for England as a whole.
Screenshot 2022 08 16 at 19.03.09

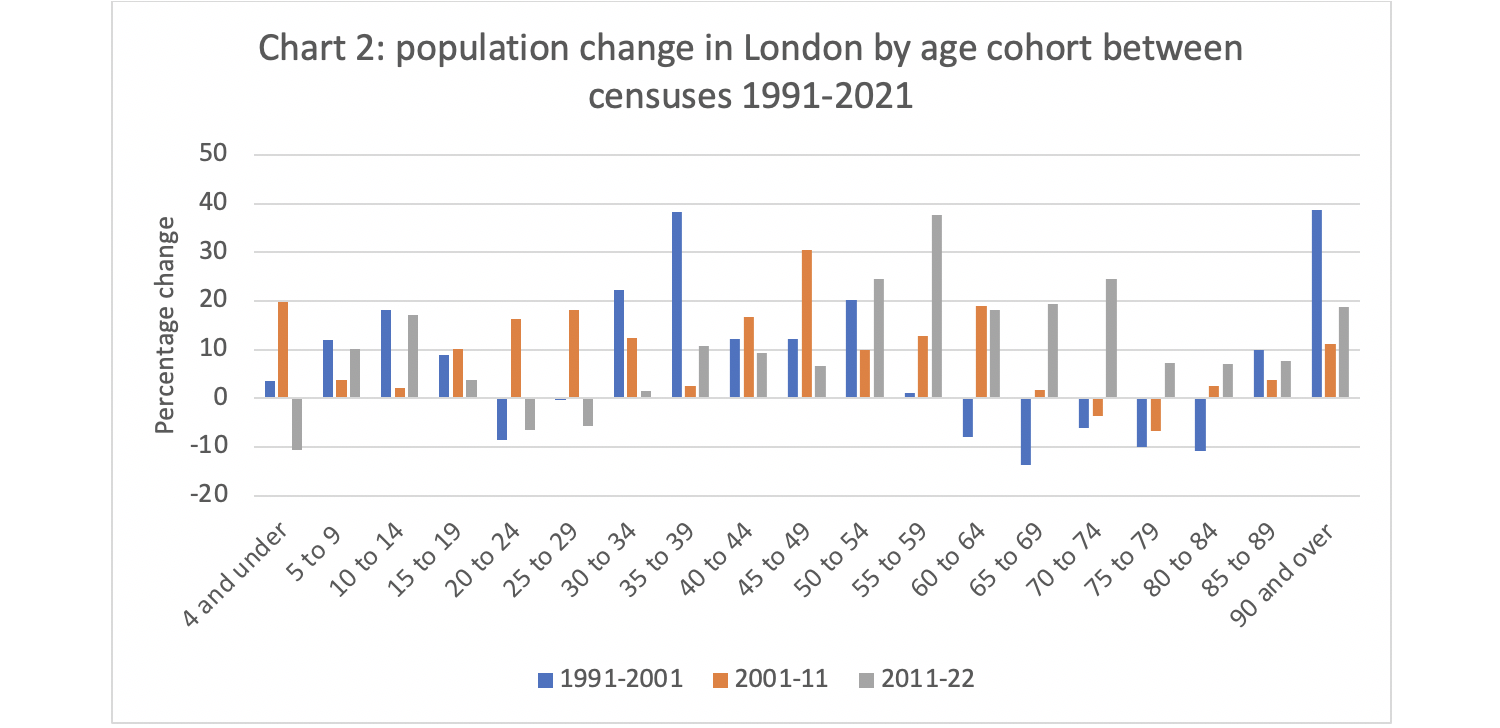
The second puts these changes in context by comparing the last decade in London with the findings for the capital of the previous two censuses.
Screenshot 2022 08 16 at 19.05.34

Here are five conclusions that can be drawn.

One: Baby boom and bust spells turbulence for education authorities

London had a baby boom between 2001 and 2011, adding more than 100,000 under-fives (a 24% rise in the age cohort). This was reversed in 2011-21, with the numbers of under-fives dropping particularly fast – by 16% in inner London.

Some of this change may be the result of young families moving out temporarily during the pandemic but, as  Greater London Authority demographers have explored, the birth rate more or less peaked around the time Boris Johnson started boasting of a London 2012 conception bonanza and has fallen back since then.

This makes planning school places fiendishly complicated: while demand for primary places fell in most of inner London, the outer H-boroughs (Harrow, Hillingdon and Hounslow) saw some of England’s highest growth rates for primary age children. And as the 2000s baby boom fed through, the secondary school cohort has grown much faster: Barking & Dagenham’s 10-to-14-year-old numbers grew by 43%, the fastest in England, with Hounslow, Richmond and Tower Hamlets close behind.

Two: London’s loss of young people was rural counties’ gain – at least temporarily

Between 2001 and 2011, 15 to 30-year-olds accounted for a net growth of around 300,000 people (around a third of London’s total net growth), reflecting the city’s magnetic pull for young people seeking to study, work or simply enjoy their lives. This contrasts with the overall stagnation in that population group in the previous census period spanning 1991 and 2001 and what looks like an almost comical reversal of the early century trend between 2011 and 2021. Rather than flocking to London, twenty-somethings seem to have headed down some deep country roads. For example, Test Valley, East Devon, Maldon and Harborough have seen the biggest rises in their numbers of 25 to 29-year-olds.

Some of this probably does reflect long-term relocation to new hipster heartlands of the West Country and the Kent and Sussex coasts, driven by soaring London rents and the ever-wider availability of flat whites. But I suspect that much more of this apparent exodus has already reversed, as young people who moved back to parental homes during the pandemic or began their university studies online have returned to larger towns and cities. The GLA’s helpful guide to the census uses payroll data to show just how many early-twenties workers left the capital during the pandemic and came back in autumn 2021.

Three: London’s boomers are booming

London’s middle-aged population (yes, including “Gen X”-types as well as “Boomers”) has soared, seeing some of the highest growth rates in England. The number of 55 to 59-year-olds in inner London grew by more than 45%, including by around 60% in Southwark, Lewisham and Lambeth. This contrasts sharply with England as a whole, where this age group grew by a more modest 27%. The London growth is also much faster than in previous decades: the 55 to 59-year-old population increased by 13% between 2001 and 2011, and by a negligible 1% the previous decade.

Some of this probably has its roots in London’s rapid growth of 35 to 39-year-olds in the 1990s, though of course there will have been plenty of churn between the census years. But it is interesting to consider why this generation may have chosen to stay in the city – and in inner London in particular – a rather than moving to the suburbs or a Home Counties village.

This was a generation that was able to benefit from relatively low house prices in the early 1990s following the property crash at the start of the decade. As mortgages are paid off, properties that were bought for tens of thousands of pounds are now valued at ten times as much. At the same time, since the pandemic, there has been a nationwide fall in the number of over 50s in the labour market.

It’s too early to join the dots convincingly between these trends – to say confidently why the numbers of middle-aged people have risen so fast in inner London boroughs. But we can speculate. Is this a “boomer belt” of reasonably well-off homeowners? People who may have stopped working and don’t feel the same financial pressures as younger Londoners in precarious housing, some of whom don’t see any great urgency in building more houses in established neighbourhoods? Interestingly, Brighton and Hove, which has similarly high housing demand and constrained supply, has seen a very similar demographic shift over the past decade.

Such stability makes for liveable neighbourhoods and lively local shops, cafes and restaurants. But at what price? If high prices and low supply squeeze younger and poorer people out of the inner city neighbourhoods, or even block them from moving there in the first place, stability may be at the cost of vitality and – in the longer term – economic productivity.

Four: London is ageing, even though not as fast as we thought

If London’s boomers stay in the city we will also see a big bulge in the older population when we come to review the 2031 census. Over the past ten years, London’s sixtysomething population has grown a lot faster than the English average. Among the over 70s, growth has been slower, though boroughs such as Waltham Forest and Redbridge have been closer to the national average.

As the GLA predicted, the census figures showed that previous estimates had over-done the size of London’s elderly population. However, growth is coming, and as today’s 60-year olds enter their seventies around the time of the next census, there will be a corresponding growth in demand for health and care services, making their currently dysfunctional funding and management an ever more urgent issue for London. It will also bring into sharp focus the issues of specialist housing for older people that were explored by my former Centre for London colleagues last year.

Five: Something was happening in 2021, but we don’t yet know what it is

The pandemic was probably more disruptive for London than any event since the Second World War (when no census took place). While its impacts were not as cataclysmic for city living as some predicted, we still don’t know what the long-term effects will be on working patterns or on how and where people choose to live. Nor do we know how new immigration arrangements, political change and the looming recession will affect the capital.

There may be a case for a mid-term census in 2026, as suggested by economic geographer Danny Dorling. But London will undoubtedly need to draw on data from the latest census and beyond to understand the city, who it is working for, and how it is changing.

First published by OnLondon.

Into the red

Levelling up has stalled, according to IPPR North’s latest analysis of public expenditure figures. The think tank’s press release highlights a 25 per cent real terms rise in spending per person in London between 2018/19 and 2020/21, compared to 20 per cent across England and 18 per cent in northern regions. IPPR North Research Fellow Ryan Swift said, “Our analysis suggests that levelling up was, in many ways, business as usual.”

These expenditure comparisons are a regular feature of regional inequality discussions, and are a pretty poor measure at the best of times. In every region, they aggregate places of great wealth and poverty. They also mix expenditure that represents investment in public services and infrastructure, with expenditure on welfare payments and support where local communities and economies are struggling. Everybody would want more of the first, but to need less of the second.

Transport spending figures are particularly contentious. While IPPR North research has repeatedly pointed to higher transport spending in London when arguing for more funding, Greater London Authority analysis from 2017 argued that, while London’s public expenditure on rail is high if compared to its resident population, it is much lower than the Midlands and North if compared to the number of journeys taken on it (with similar comparisons for expenditure on roads).

The pandemic has made such comparisons even more problematic. As both IPPR North and the Office for National Statistics (ONS) note, 2020/21 expenditure figures include huge sums spent on coronavirus support schemes such as furlough, self-employment support and business loans, all of which saw very high take-up in London, which has a bigger economy and many more jobs than any other region. But even when you take these costs and health spending out of the equation, IPPR’s analysis still shows London with eight per cent growth over three years, compared to three per cent across England and two per cent in the North.

What accounts for the rest of the increase? Welfare and transport primarily, according to the ONS analysis. Unemployment-related benefit claims shot up much faster in London than in the rest of England as the economy went into hibernation in 2020, as reported by Centre for London. And the capital city’s public transport system saw a devastating loss of fares revenue, relying on short-term government handouts to remain solvent. Far from being a sign of favouritism, this boost to spending in London is a symptom of a capital city on life support as the pandemic laid waste to its economy.

Extraordinary responses to extraordinary circumstances should be temporary, so the expenditure gap between London and other UK regions should narrow in coming years. But it is the other side of the fiscal balance sheet that should worry us all in the longer-term. Alongside increases in expenditure, taxes raised in London fell by £6.7 billion in 2020/21, with business rates accounting for nearly half that reduction, followed by VAT, stamp duty and air passenger duty. In 2019/20, London made a net contribution (total revenues minus total expenditure) of £40 billion to the UK; in 2020/21 London had a net deficit of £7 billion – the lowest deficit in the UK, but still a dramatic change in fortunes.

From this perspective, the pandemic has in fact closed the gap between the UK regions, but only by levelling London (and the South East) down. So we should be careful what we wish for as we emerge from the coronavirus crisis into a new age of economic instability. Yes, London should be arguing for the government investment in green jobs and neglected infrastructure that will help northern regions realise their potential. But all of us should also be making the case for supporting London’s economy, so that the UK’s premier global city can once again generate the revenues that will help turn these aspirations into reality.

First published by OnLondon.

9 to 5?

With Cristian Escudero

How many people are working from home, and how many have returned to the office? The answer to this – apparently simple – question is surprisingly complicated.

Estimates have varied – as the pandemic has waxed and waned, as government guidance and regulation has changed, and as different surveys have asked subtly different questions. As part of a new project at King’s College London, Work/Place: London Returning, we have been comparingthe different surveys and what their results tell us, alongside our own Wave 1 Work/Place survey of London’s workers. 

Although the headline figures emerging from the various surveys have varied, one feature has remained consistent throughout: London’s experience has been different to the rest of the UK’s. The capital saw more people furloughed at the beginning of the pandemic, and has persistently had more people working from home. For example, in its 2020 round of interviews, the Office for National Statistics (ONS) Annual Population Survey (APS) found that 37 per cent of London’s workers had worked at home the previous week, compared to 26 per cent across the UK. In January to March 2021, the ONS Opinion and Lifestyle Survey found that up to 65 per cent of Londoners and 46 per cent of people across England had worked from home as a result of Covid the previous week. In late March 2022, the same survey showed that around 26 per cent of the UK population worked from home, while 37 per cent of Londoners did. Most recently, in July 2022, ONS analysis showed London had seen sharper rises in homeworking, and bigger drops in commuting from out of region, than any other English regions between late 2019 and early 2022.

Remote working has always been more prevalent in London: APS data shows that 18 per cent of London’s workers had worked from home in the week prior to interview in 2019, compared to a UK average of 12 per cent. But why are people who live and/or work in London (the groups are similar but not the same) so much more likely to work from home, and are they likely to return to the office over time?

There are some factors that enable London’s workers to work remotely and there are others that encourage them to do so. More London workers can work remotely because of the industries they work in. As our paper sets out, many more Londoners work in professional services, and information and communications roles – for example, as lawyers, accountants, consultants, TV producers, IT consultants, architects. These jobs accounted for 22 per cent of London employment, but only 14 per cent across England. These were also the jobs that switched online most easily: in January 2021, employers in England estimated that 44 per cent of professional services workers and 59 per cent of information and communications workers had been working from home in the previous two weeks.

By contrast, in sectors such as hospitality – which rely heavily on face-to-face contact and account for a similar proportion of jobs in London and across England – nearly 75 per cent of staff were on furlough at that time. London’s workforce split between the workers who took their work home, and the workers whose work vanished as commuters and tourists stayed away, which also explains why the capital had both the most resilient productivity, and the highest rises in unemployment during the pandemic compared to other English regions.

Industrial structure accounts for some but not all of the difference. The effect is compounded by occupational structure: 62 per cent of Londoners worked management, professional or associate professional jobs in 2021, compared to 50 per cent across England. Around 40 per cent of people doing these jobs worked from home for at least one day the week before they were interviewed in 2020, compared to caring, skilled trade and customer service jobs, where 10 per cent or fewer reported doing so.

These features of London’s workforce help to explain why Londoners and London’s workers (overlapping but distinct groups) can work from home; the Work/Place survey also sheds light on why they are choosing to do so – at least some of the time. The survey found that the costs of commuting, and the time it takes, were the leading factors behind home-working. While respondents valued the flexibility of working from home, they did not dislike their office environment – on the contrary, many valued the sociability and buzz of their London workplace – but disliked the time and expense of daily commuting.

Commuting is a big cost – in terms of time and money – for people living and working in London. Labour Force Survey data for London boroughs showed their residents commuted an average of 39 minutes each way in 2016, compared to 28 minutes for other English local authorities, and showed similarly lengthy commutes for people living in commuter districts such as Chiltern, Dartford and Elmbridge. One London PR agency has estimated that commuting can cost £8,000 or more every year, when additional childcare costs are added to season ticket costs – equivalent to 22 per cent of the average PR salary after tax.

London workers have both the capacity and incentives to work from home, at least some of the time, and the fact that leisure visits have been recovering faster than workplace visits suggests that it is long-term changes in habits rather than short-term fear of infection that is influencing behaviour. Against this backdrop, it is unsurprising that our Work/Place survey found that only a minority think that the five-day commute will return. For the moment, the preference seems to be for hybrid working, with around 45 per cent of London workers viewing two to three days working from home as optimal. Culture and practice will shift the dial one way or another in specific organisations and industries, as would government action on the costs of commuting and childcare, but our research suggests that the impact of the pandemic on London’s work patterns has been significant and will be long-lasting.

First published by Kings College London.

Inverted pyramid of Pfeffel – Boris Johnson’s legacy

July 2012 was an odd time for me. I was working at London Legacy Development Corporation (LLDC) in offices minutes away from the Olympic Park, but as the London 2012 Games drew closer, it was clear there was nothing much for me to do. Not being a big sports fan I hadn’t bought any tickets, so a couple of days after the opening ceremony I flew to a small Greek island, where cheers from the local bar were the only indicator of London’s growing medal tally.

The LLDC itself had only been established a few months earlier. After years of wrangling between the Mayor of London and government, planning and delivering London’s Olympic legacy would be wholly in Boris Johnson’s hands.

You can probably guess what happens next. You expect chaotic bumbling, classical allusions, questionable personal morals, sound and fury signifying nothing. Boris Johnson’s behaviour has so tarnished his reputation in recent weeks and months that it is hard to even entertain the thought that good things came out of his mayoralty. But some did – and most of them are in the Queen Elizabeth Olympic Park.

Early signs were not auspicious. Following his election in 2008, one of Johnson’s first moves was characteristically whimsical. After a chance meeting with steel tycoon Lakshmi Mittal, he launched a competition for an “Olympic tower” as a landmark within the Olympic Park, which resulted in the tortuous steel folly that is the ArcelorMittal Orbit. 

Apart from this, the Mayor more or left the construction programme for the Games – well advanced by 2008 – to run its course. Instead he looked to legacy, re-opening the issue of getting a football club into the stadium (a saga in itself, and one extensively covered in Dave Hill’s excellent Olympic Park book), backing the establishment in 2009 of the Olympic Park Legacy Company (an uneasy joint venture between the government and the Mayor), and working with David Cameron’s government to convert this into what became the LLDC – a mayoral development corporation with more powers over planning and singular accountability to the Mayor’s office.

He also cast a wary eye over the plans for the legacy development that would follow the Games. A new masterplanning team, comprising Allies and Morrison and EDAW, who had worked on the Olympics masterplan alongside the Dutch firm KCAP, had been appointed just before Johnson was elected. Their plans for the Park included large scale urban blocks – like those eventually built in the athletes village – filling in the space between the retained venues and parkland. 

These would have made a striking contrast with surrounding neighbourhoods of terraced housing – not necessarily a bad thing, but not to the incoming Mayor’s taste. I want Georgian terraces, he told the design team at one meeting. Yes, they replied, we need to reinvent the terraced townhouse as a 21st Century typology. No, he insisted, I want Georgian terraces...

Beneath squabbles over architectural and urban form were deeper issues of money. The government had pushed for a design and delivery schedule that could generate enough capital receipts to repay debt that had been incurred in buying up land and borrowings from the National Lottery to pay for the Games. Denser development would yield higher returns, and house prices growing at 10 per cent a year would make later phases of development particularly valuable – at least on spreadsheets. 

As the Mayor and his advisors began to engage with the plans in the expectation of control shifting from Whitehall to City Hall, the Legacy Masterplan Framework was reinvented as the Legacy Communities Scheme, launched in 2010. Gone were most of the giant “European” perimeter blocks, as forms shifted to something reflecting what design advisor Ricky Burdett talked of as “London’s DNA”– terraces, townhouses and dense streets (with a few neo-Georgian flourishes to please the Mayor in the computer-generated images). We reworked the spreadsheets to show that debt could still be repaid, but this began to feel like an incidental, rather than central, objective for the legacy plan.

More change came in 2012, when Margaret Ford was replaced as LLDC chair first by Johnson’s idiosyncratic deputy Daniel Moylan, and then – after only a few months – by the Mayor himself, supported by Neale Coleman as deputy chair. Dennis Hone moved over from the Olympic Delivery Authority to replace Andrew Altman as chief executive and was asked to accelerate construction: the development corporation should act as a public body, not as a commercial developer; it should build housing, not bank its land while house price inflation stored up treasure in the future. 

A further dent in the spreadsheets came when Boris Johnson decided that Queen Elizabeth Olympic Park needed more than sports venues, mid-scale housing and a beautiful park. The success of the 2012 Games had piqued the interest of museums and universities, who had previously regarded the Park as a potential location for student housing but not much else. Boris Johnson became a cheerleader for a new cultural and educational district, dubbed Olympicopolis – a nod to the “Albertopolis” legacy from the 1851 Great Exhibition in South Kensington (and now renamed by his successor as East Bank, itself a reference to the 1951 Festival of Britain’s legacy).

The only problem with the plan – enthusiastically promoted by the Mayor as transformational to the global image of east London – was that it involved filling Stratford Waterfront, the most valuable site in the Park, with development that would require investment rather than generating receipts. Nevertheless, the Mayor pushed the plans forward, shepherding the Victoria and Albert Museum, University College London, Sadler’s Wells dance theatre and the London College of Fashion to agreement, securing capital investment from George Osborne’s increasingly-austere Treasury, and – less successfully – establishing a charity to fill the funding gap.

It is, of course, quite possible that another Mayor of London would have pushed back on spreadsheet architecture, and reshaped the Olympic Park plans to look “more like London”as Johnson did. It is possible too that another would have captured the imagination and commitment of Olympicopolis partners. But these changes in emphasis were distinctly Johnsonian in their chutzpah, their ambition and their grandiose historicism – even if accompanied by an equally characteristic blitheness about affordable housing and capital receipts. Ten years on, if the planning of the Games was Ken Livingstone’s, the shape of legacy is Johnson’s. 

First published by OnLondon

When tube lines go to war, one is all that you can score

The role of Parliamentary Assistant for the London Underground (Green Park) Bill sounded pretty exciting when the temping agency suggested it to me. Newly arrived in London at the height of the 1990s recession, I needed work and entertained daydreams of passing notes to MPs, briefing journalists and crafting ingenious arguments about, er, something to do with extending the Jubilee Line?

The Sisyphean reality – photocopying and bundling documents, then unbundling and shredding them a few days later – was a bit less glamorous. It was autumn 1993 and the Bill – the last piece of enabling legislation for the Jubilee Line extension (JLE) – was already in its last stages. Construction contracts had been let, and the parliamentary team started to disperse. 

Many of them moved round the corner to Dacre Street to work on Crossrail, which was the next big transport project. Or at least it was until May the following year, when a House of Commons committee stopped the bill process dead in its tracks. What I didn’t realise at the time was how intense competition had been between the JLE and Crossrail, and how significant this competition and its outcome would be for London’s evolution in the decades that followed. 

Both Crossrail and the JLE can trace their lineage back to the 1970s or beyond, but gathered momentum in the late 1980s, those strange years when London lost its metropolitan government yet saw resurgent economic growth and the first signs of population recovery after 50 years of decline. Secretary of State Paul Channon’s foreword to the Central London Rail Study, published in January 1989, referred to the capital’s economic growth “putting severe strains on London’s transport system”. The study proposed an east-west ‘Crossrail’ (as well as alternative Chelsea-Hackney and Victoria-Euston-Kings Cross options), and detailed project planning was given the go-ahead the following year. 

But something was stirring in the east. In 1981 Michael Heseltine, Secretary of State for the Environment (which then included local government and urban policy), had established the London Docklands Development Corporation to find new uses for the swathes of land left derelict by the closure of east London’s docks. Rail and road infrastructure – including the Docklands Light Railway (DLR) – had been an early priority, based on the loose expectation that the docks would be redeveloped for a mixture of housing and light industry.

All that changed in 1984 when American banker Michael von Clemm visited Canary Wharf. Von Clemm was looking for food preparation units for Roux Brothers Restaurants, in which he was an investor, but returned to his offices at Credit Suisse First Boston to propose that the bank could build offices there rather than continuing to haggle over floor space with the deeply conservative City of London Corporation. Michael Cassidy, the City’s then chair of policy and resources, recalls von Clemm taking him to the site and saying, “I’m going to build my office here, and I’m going to blame you – the City – for making me do it.”

A succession of plans, changes of ownership and bankruptcies followed, but in 1987 Olympia and York (O&Y), the Canadian developers of Battery Park City in New York, signed a development deal to build 12 million square feet of offices at Canary Wharf. This would mean 50,000 daily commuters, way beyond the DLR’s capacity, so O&Y promised to build a new railway line – unofficially and unfortunately known as the Canaryloo Line – to run from Waterloo through Canary Wharf to Greenwich. 

Margaret Thatcher’s government liked the entrepreneurial spirit of the proposal, but Department for Transport officials were nervous of freelancing rail schemes, so a separate East London Rail Study was commissioned to review options for improving access to Canary Wharf. It reported in July 1989 and recommended that the Jubilee Line be extended via Canary Wharf and North Greenwich to Stratford. The total cost would be around £1 billion, of which O&Y would pay the £400 million they had earmarked for their own project.

By summer 1989, therefore, two rail mega-projects were eyeing each other uneasily on the starting blocks. The government was committed to maximising private sector contributions to both, which gave the JLE an advantage, as private finance was already committed to it. So the JLE overtook its venerable competitor in securing parliamentary approval: the main bill was introduced into Parliament in late 1989 and received royal assent in March 1992, while the Crossrail Bill did not have its first reading until November 1991.

Just as many in the City saw Canary Wharf as a threat to their pre-eminence as a financial centre, the JLE’s rapid parliamentary process alarmed many of Crossrail’s supporters – particularly central London property companies such as Hammerson, Land Securities and Grosvenor – which feared that the usurper railway would boost Canary Wharf at the expense of the City. As the 1992 general election approached and the UK slipped into recession, a new coalition began to assemble, galvanised by the need to prevent Crossrail being sidelined.

This coalition, led by Sir Allen Sheppard of leisure conglomerate Grand Metropolitan, was formally launched after the election as London First. Robert Gordon Clark, who became London First’s head of communications the following year, says their primary focus on lobbying for Crossrail to be built either ahead of or alongside the JLE led one property journalist to rename them “London First, Docklands Second”. 

But by then, the JLE had problems of its own. The global recession had hit O&Y’s north American holdings hard, and in May 1992 its creditor banks pushed the company into administration. The JLE  had received royal assent but its funding package had collapsed. “I had to work very, very hard to get the Jubilee Line extension underway, because at the time the Treasury just didn’t want it. We were in recession and they were fighting very hard to avoid any capital expenditure,” recalls Steve Norris, who, after the election, was appointed minister for transport in London. 

The Treasury insisted that the banks who now owned Canary Wharf maintained O&Y’s £400 million commitment, perhaps hoping this would kill the scheme off but, as Norris observes, funding the JLE was the only way for the banks to recover their losses: “Their property in Canary Wharf had virtually negative value at that time. With the kind of rents you could get without decent connectivity, the whole thing was a liability not an asset. So all the banks signed up, which made it very difficult for [the Treasury] to refuse. But they were dragged kicking and screaming.”

Lagging two years behind the JLE in Parliament and lacking committed private sector finance in the wake of a recession, Crossrail was more vulnerable. In May 1994, the four-person committee reviewing the Crossrail Bill threw it out. The committee’s issues with the scheme included its lack of connectivity to the Channel Tunnel Rail Link, falling Tube usage (which was 20 per cent down on its 1980s peak by 1994), and above all the lack of committed funding from either the Treasury or private finance. 

Transport schemes never quite die, of course, so Crossrail was sent into a limbo of new designs, parliamentary procedures, cost-benefit analyses, studies, spending reviews, business cases and consultations. London First kept the flame alive, particularly when Labour came to national power in 1997 followed by London’s newly-elected Mayor Ken Livingstone worked closely with both the City and Canary Wharf to make the case for the scheme, which broke ground in May 2009.

As the Elizabeth Line finally opens, it feels like closure for this chapter of London’s history, even if Crossrail 2 (the old Chelsea-Hackney line) is receding into the future. The JLE stole a march on Crossrail by having a single private sector stakeholder with deep pockets, and by being first out of the parliamentary stocks (though the delivery of the scheme was beset by overruns and delays). It shouldn’t be this way, but sometimes being first is as important as being best. 

But it is hard to argue that the Jubilee Line extension should have been ditched. Without it, Canary Wharf’s development would have been blighted and London’s development would have been dramatically altered: no second financial centre, no Millennium Dome on the heavily polluted Greenwich Peninsula and maybe no Queen Elizabeth Olympic Park in Stratford. By accident and design, the JLE was transformational. Perhaps Crossrail would have gone ahead more quickly without it, and perhaps it would have been completed in time for the 2012 Olympic and Paralympic Games. But, given the constraints on public spending in the 1990s, perhaps not.

The most enduring legacy of the rivalry between these rail schemes was the galvanising effect they had on London’s businesses and local authorities, impressing on them the urgency of coming together to lobby for the capital’s needs – including for the introduction of a directly elected Mayor, later championed by London First. It is a coalition that still needs to speak for London today.

First published by OnLondon.

More house, in the middle of our street

Michael Gove was on fizzy form yesterday morning as he sought to sell his package of housing and planning reforms over the airwaves. “Beauty! Infrastructure! Democracy! Environment! Neighbourhoods!” he proclaimed, arguing that local empowerment would lead to better homes being built and fewer new developments being opposed. Coming from a minister once described by David Cameron as “Maoist” this sounded positively Leninist – All Power To The Neighbourhoods!

“Street votes” are at the heart of Gove’s announcements, though there is almost no detail about them in the draft Levelling Up and Regeneration Bill. They respond to a question often aimed at those arguing for the regeneration of social housing estates – why are you picking on social tenants? Why don’t people living in privately-owned neighbourhoods have to densify? To which the obvious retort is, why would they when they would see the pain of new development, but none of the gain?

The idea of street votes, developed by Samuel Hughes and Ben Southwood at Policy Exchange but with broad-based political support, is to put in place a framework that will encourage such densification. Local residents would be able to prepare plans and design codes for making their streets more dense – through infill, through upwards extension, through demolition and rebuilding – resulting in more homes to meet need, profits for local property owners, and tax revenues for local authorities. Even if you excluded older and listed buildings, the Policy Exchange report estimated 800,000 homes in London would be eligible.

The proposal is not a cure-all for the housing crisis in the capital or anywhere else, but it could be a part of the solution (I was one of the many endorsers of the original report). Street votes align incentives locally and could stop London’s new development being so “lumpy” – miles of untouched terraced housing interrupted by occasional eruptions of towers.

Ominously, some media reported (or were spun?) the policy as an opportunity to veto new development, and the biggest risk is that neighbours are unable to agree how or even if they want their street to change. In that case, resident and council time has been wasted, but people would still have the option to seek to extend or subdivide their own homes. Street votes won’t work everywhere, but that’s no reason to reject an idea that could work somewhere.

The other major measure that has been reported is a standardised infrastructure levy to fund affordable housing, and the roads, schools and surgeries which new homes need but are often a bone of contention for their opponents. A clear tariff for new development would create more transparency for developers, councils and communities.

Background papers to the Queen’s Speech indicate that this will be set locally, responding to concern that a national tariff would stifle development in some places while not meeting the costs of new infrastructure in others. Nonetheless, in the age of “levelling up”, there is an understandable worry that a levy would be used to siphon money away from London, hobbling its ability to build the 100,000 homes a year that government still insists are needed, even though the draft Bill underlines that the levy is designed to meet local costs.

But the bigger problem with the new draft Bill is what it doesn’t do. Stripped out since the Planning White Paper is any idea of a national system of zoning, by which councils and communities would identify the sites for new development and agree the design codes that would manage this. Like standardised tariffs, these were intended put in place up-front public consultation rather than scheme-by-scheme negotiation, which favours larger housebuilders with deep pockets and serried ranks of consultants to support them.

Gone too (or maybe not) are the targets that would hold government’s and councils’ feet to the fire. “I don’t want us to be tied to a Procrustean bed,” Gove mused cryptically on Radio 4, referring to the Greek myth about an innkeeper who would stretch his guests to fit his bed, or lop bits off until they did, although a government spokesman later confirmed that the national target of 300,000 homes in England per year still stood.

Enabling local residents to shape new developments, pushing for better design and ensuring that new building can be backed by the infrastructure that makes places work, should help reduce opposition to new development, particularly in gently pushing up densities in cities such London. But it cannot be the entire response to an ever-worsening housing crisis. Even if Londoners become uncharacteristically excited about new development, gentle densification of 800,000 homes in London would not easily deliver 100,000 homes a year. Cities need big plans, as well as thousands of small ones.

First published by OnLondon.

Bringing it all back home

London has had a rough two years since the pandemic started. The capital has been at the forefront of successive waves of Covid, commuters and tourists have stayed away, and Transport for London seems to be being kept alive by government in much the same way that a mouse is kept alive by a bored but malevolent cat.

In some of the city’s bleaker moments commentators have wondered whether it will ever recover – some doing little to disguise their glee. At the beginning of last year, decline enthusiasts seized on an analysis of Labour Force Survey stats, which estimated that London’s population might have declined by 700,000 – nearly eight per cent – since the beginning of the pandemic, mainly as a result of foreign workers leaving the capital. Would these workers ever come back? Would the city ever recover?

New statistics out this week from the Office for National Statistics suggest that, while employment of foreign workers in London has fallen, any exodus has been a trickle rather than a flood. Between June 2019 and June 2021, payroll employment fell by around 110,000 in London. Broken down by nationality, employment fell by 40,000 for UK nationals and by 85,000 for European Union nationals, but rose by 15,000 for other foreign nationals.

The chart below tracks employment numbers compared to June 2019. Across the country, UK and EU employment has fallen while employment of people from the rest of the world has risen. The switch from EU to broader international immigration reflects the UK’s new immigration regime, introduced at the beginning of 2020, which gives EU citizens the same status as people from other countries.

Screenshot 2022 03 03 at 16.29.29

The trends are similar in London to the rest of England, but the falls were deeper and steeper in the capital and recovery has been slower, as industries such as hospitality have struggled to emerge from the pandemic. But the changes are much less dramatic than previous estimates suggested. Even in the first year of the pandemic only 100,000 European workers left employment, and by spring 2021 the trends were being reversed for all groups. EU worker employment increased by 20,000 between January and June 2021.

There are some striking differences between sectors too, some more surprising than others. The sector with the steepest job losses, hospitality, saw a reduction of 30 per cent in employment of EU workers. It remains to be seen how far these numbers will rise again as London’s commuters and tourists return, and whether new jobs will be taken by UK, European or other overseas workers. Towards the end of last year a staffing crisis hit hospitality, but the government has ignored calls to make work permits available for more roles in the sector.

Other areas with sharp EU job losses included administration and arts, entertainment and recreation. In construction, on the other hand, the EU workforce grew by 12 per cent between 2019 and 2021, and the number of other international workers by 15 per cent, while the UK national workforce remained unchanged.

We should not place too much store by these figures. They estimate the number of people employed using HMRC payroll data, so they are not precisely equivalent to job numbers, still less to population numbers. But they do give an indication of the direction and scale of change.

Can we conclude anything about population numbers? At a push. If we take UK nationals out of the picture and make the (fairly bold) assumption that the ratio of population to payroll employment for the EU and international workers was roughly the same in 2021 as it was in 2019, it looks like London’s foreign national population might have dropped by around 100,000 in the two years to June 2021. That is a big drop in a city used to net international immigration of 80-100,000 people every year, but it is a lot a lot less than some estimates and it looks as if London is already well on the way to making up lost ground.

Two years ago, I suggested that the shift to non-EU immigration would favour London, all other things being equal. All other things have certainly not been equal, but London’s loss of overseas workers to date has been in line with the colossal international disruption we have seen over the past two years. As we recover and our global connections re-open, London’s growth may once again be turbo-charged by international migration.

Missions Aspirational

You have to feel for Michael Gove. Rarely has a document been freighted with as much expectation as the levelling up white paper, which has been promised in one form or another since 2019. But even as the Department for Levelling Up, Housing and Communities was being given its new remit the spending shutters came down, ruling out new money – at least on the scale needed to radically alter hundreds of years of economic development.

Without new money the white paper sets direction rather than powering engines, though it does offer a few enticing hints of change. It promises, for example, to push devolution further and to bring some clarity and consistency to England’s idiosyncratic patchwork quilt of local government, and it celebrates the role of local policy-making. It even suggests that mayoral combined authorities and the Greater London Authority might bid for “sweeping further powers”, though it stops short of any significant transfer of fiscal powers.

And it does at least tell us what the government thinks “levelling up” is. At the core of the paper are 12 targets for 2030, heroically rebranded as “missions”. Advocates of mission-thinking as a way of galvanising action often point to John F Kennedy’s commitment to put a man on the moon by the end of the 1960s. Note that JFK didn’t make 11 other commitments at the same time. But most of these targets are laudable, even if the lack of detail on delivery makes them feel rather “aspirational”.

It is notable that most of them focus broadly on national improvements in social and economic conditions – job numbers, productivity and pay, violent crime, wellbeing, pride in place, school standards, adult training and home ownership – rather than explicitly on closing the gap between “LondonAndTheSouthEast” and other regions, which can of course be achieved by levelling up or by levelling down. Essentially the missions argue that all should rise together, though several qualify this by specifying that the worst-performing places should see the sharpest improvements.

Some targets are more explicit in their focus on narrowing gaps. Public transport across the country is to be “significantly closer to the standards of London” by 2030, which is a slightly ambivalent pledge given the cutbacks being considered by Transport for London in the absence of a long-term funding deal. It also does prompt a raised eyebrow – can other cities, let alone less densely populated towns, really support services like London’s?

The focus on narrowing the gap in healthy life expectancies also stands out, though the detail remains to be filled out in a separate white paper on health disparities later this year. In the meantime, the question of what geographies you use to judge success will be vital. As previously remarked here, the difference between places within the same borough can be every bit as stark as those between different regions.

There is a little more meat in the two economic missions. One pledges to improve pay, employment and productivity in every area of the UK – which should be good news for London, where productivity growth has stalled in recent years. The other proposes rebalancing public expenditure on research and development (R&D) outside the Greater South East. This could be one of the strongest measures in the white paper. Public spending on R&D is heavily focused on the “golden triangle” of London, Oxford and Cambridge, and there is a good argument that this concentration is failing on the grounds of economic efficiency as well as fairness.

Rebalancing investment to where it can make a real difference both directly and through attracting private investment rather than insisting it is spread evenly throughout the country, could make a real difference. The promise of £100 million for three new “innovation accelerators” in Greater Manchester, the West Midlands and Glasgow suggests that the need for focus is understood. Any switch of resources from London to other parts of the UK is likely to feel harsh, but a rebalancing of R&D spending is worth contemplating as a way of building up the knowledge economy in other cities.

Much less helpful is the white paper’s restatement of the government’s plan to divert funding for housing away from the areas of lowest housing affordability – that is, London and the South East. Doing so seems to fly in the face of its protestations that “levelling up is not about making every part of the UK the same, or pitting one part of the country against another. Nor does it mean dampening down the success of more prosperous areas”.

Less money for affordable housing in London is not likely to be good for London or the UK. London’s housing crisis is likely to worsen, with one of two results or a mix of them. Either the capital’s economy will suffer, with consequences for the rest of the country, or living in London will become more exclusive, further detaching the capital from the rest of the country. Investing to lever growth into other cities is a worthwhile endeavour. Removing support for infrastructure in places that most need it seems short-sighted and even spiteful.

Originally published by OnLondon.

Living in The City

It is an unlikely proposition on the face of it – a new block to house 644 students nestled among the polished steel and plate glass of corporate lawyers’ and consultants’ offices on High Holborn, just opposite City Thameslink Station. But this is the planning application the City of London Corporation’s Planning Committee will consider on Tuesday, with officers recommending approval.

Student housing in the heart of the City? Is this a harbinger of changing times – even of decline – as London comes to terms with “life after Covid”?

City of London planning policies, backed by the London Plan, have always been stalwart in defending the Square Mile’s unique mix of “world city” commercial functions. Loss of office floor space, the corporation’s policy says, should be considered only in exceptional circumstances. And the recent boom in privately-developed student housing has been controversial. As this project indicates, it has generated good returns for investors but is often seen as disruptive to neighbourhood life and implicated in gentrification – but, then again, what isn’t? – and has spawned some of London’s ugliest new buildings.

The High Holborn block, designed by Stiff + Trevillion on a site previously occupied by solicitors Hogan Lovells, looks far from ugly in the artist’s impressions (see image). Developers Dominvs Group originally proposed a hotel on the site, but switched to student accommodation as the pandemic laid waste to international tourism. Dominvs are negotiating a deal with the London School of Economics to house their students, and their proposal includes community and cultural spaces on the ground floor and a public roof terrace alongside the student rooms (35 per cent of which will be “affordable”).

Still, the idea of student living in London’s financial district is a far cry from how the Square Mile felt when I first came to the capital almost 30 years ago. Back then the City was a closed-off place – literally so, as the police erected roadblocks (“the ring of steel”) as totemic protection against IRA bombers – showing a rather sombre face to the outside world, however dramatic and lucrative the global trading carried out behind closed doors. By 8.00 pm the pubs had closed and at weekends the narrow empty streets felt post-apocalyptic: beautiful, calm, but also rather eerie.

But the City has been changing. Their Covid recovery plan, which triggered quickly-quashed rumours of widespread conversions of offices to homes, talked of boosting the Square Mile’s visitor economy, of opening up more on evenings and weekends, of being a “City of culture and commerce”.

But this diversification predates the pandemic. Its roots go all the way back to the 1990s, when the construction of Canary Wharf offered an alternative business district (“Manhattan on Thames”) and gave financial institutions a choice. Having survived for more than a millennium the City can tend towards the conservative, but this new challenge forced the ancient institution’s aldermen and common councillors to think again about allowing the skyscrapers that global businesses wanted, but also about what goes on at ground level – what the area offers outside office hours.

The transformation has been gradual but profound, even if it has been accelerated by Covid and the changing dynamics of London’s property markets. You can see it in the expansion of restaurants and bars – hospitality jobs have almost doubled in the past 20 years – in the new shopping centre at One New Change, in plans for the Culture Mile that will stretch from the new Museum of London at Smithfield to the Barbican and in the rapid growth of new sectors such as fintech.

Seen from this perspective, building student housing on High Holborn is a logical progression not a departure. It is the next chapter in a story of reinvention as the City seeks to bring in different types of people, who will bring life to its streets and use its amenities when they might otherwise be quiet.

The planning officers’ report points to the benefits of an “influx of a new demographic of young people” and the proximity to Smithfield, where they will find clubs and bars as well as the new Museum of London. Officers also argue that the loss of office space is marginal (around 8,000 square metres, while 800,000 square metres is in the pipeline) and observes that the engineering complexity of working above and around Thameslink tunnels makes building and pre-letting high quality offices on the site difficult.

London’s Central Activities Zone (CAZ), its retail and hospitality sectors in particular, has had a tough couple of years, as commuters and international tourists stayed away. Cities with more people living in or around the centre have fared better, and GLA-commissioned reports have suggested that a bigger residential population could be part of central London’s future too.

My former colleagues at Centre for London are working on a project to explore where and how this might be realised. This will be a complex process, which will play out differently in different parts of the CAZ. But bringing a few hundred students in to add life, and maybe a bit of mess, to the capital’s ancient heart seems like a good place to start.

First published by OnLondon.

Level 22

While we wait for the forever-delayed Levelling Up White Paper, a “levelling up mindset” is starting to take hold across Whitehall. Just before Christmas newspaper reports suggested that the latest Department for Work and Pensions review would explore whether pensions could be paid earlier in areas with lower life expectancy.

It is an intriguing idea. There are big differences in life expectancy across England. Between 2017 and 2019, a man born in Richmond-upon-Thames could expect to live in good health for nearly 72 years – almost 20 years longer than a man born in Blackburn. A woman born in Wokingham would have a similar advantage over one born in Nottingham.

But it’s a bit odd too. Faced with these yawning inequalities and the worrying fall in healthy life expectancy since 2014-16, you might think that addressing the causes of ill health and early mortality would be the focus of policy, not making sure everyone gets a comparable return on their national insurance contributions.

Allowing people to take their pension earlier in some parts of the country could also have strange consequences. Is a workforce that has been shrunk through early retirement really what economically disadvantaged places need? Would a wave of pension-seekers moving to northern seaside towns really act as a catalyst for revival?

But there is a bigger problem too. Health inequalities can be just as sharp within as between regions or even local authorities: data at “middle super output area” (MSOA) level show that in Kensington & Chelsea there is a 25-year gap in healthy male life expectancy between North Kensington and the area around Sloane Square. If we really want to target earlier retirement dates at those areas where people are likely to have least time to enjoy their pensions, should we not be looking at individual wards and MSOAs rather than large geographical areas?

Of course we won’t be doing that: such a system would be fiendishly complicated and deeply unfair to poorer people living in wealthier neighbourhoods. But it does highlight one problem with the levelling up debate. Health and other aspects of inequality are often presented in terms of geographies because we have good data collected on a geographic basis. But geography is not necessarily the primary issue, as anyone who has seen the wealth of the Vale of York or the poverty in north Westminster will attest.

This is not to say geography is irrelevant: the 2020 Marmot Review of health equity argued that, while life expectancy in richer places was pretty similar across the country, poorer places in London had better life expectancy than poorer places in the north. The review suggested that a mixture of economic and policy factors (particularly the impact of austerity) had hit northern areas particularly hard and had therefore widened the gap since 2010.

But the Marmot analysis is still comparing places – which in London contain a diverse mix of people, and may have become more mixed in recent years – rather than classes of people. Londoners on the poverty line may be only a block away from an artisanal coffee shop, but that may not help their health or other life chances.

There is research indicating links between income and health (for example, people in the poorest 10 per cent of households are ten times more likely to report poor health than people in the richest households), but it is more scanty. Most research on health inequality (and other forms) continues to use place as a proxy for a whole suite of characteristics that may offer or deprive particular people of opportunity.

My hope for 2022 is that we develop a more nuanced discussion of “levelling up”. I think this means southerners acknowledging that there are regional imbalances that do need addressing. I’d suggest that two of these are the need for investment in strategic transport schemes (rather than the apologetic bodge-job of the Integrated Rail Plan) and in research and development. But it also means that we shouldn’t make the mistake of assuming that every inequality is primarily regional in character when that may simply be a result of the basis on which we collect and publish statistics.

Originally published by OnLondon.